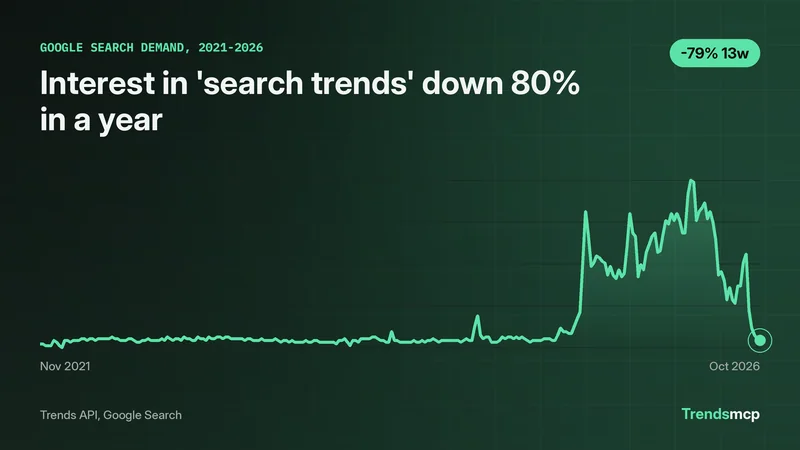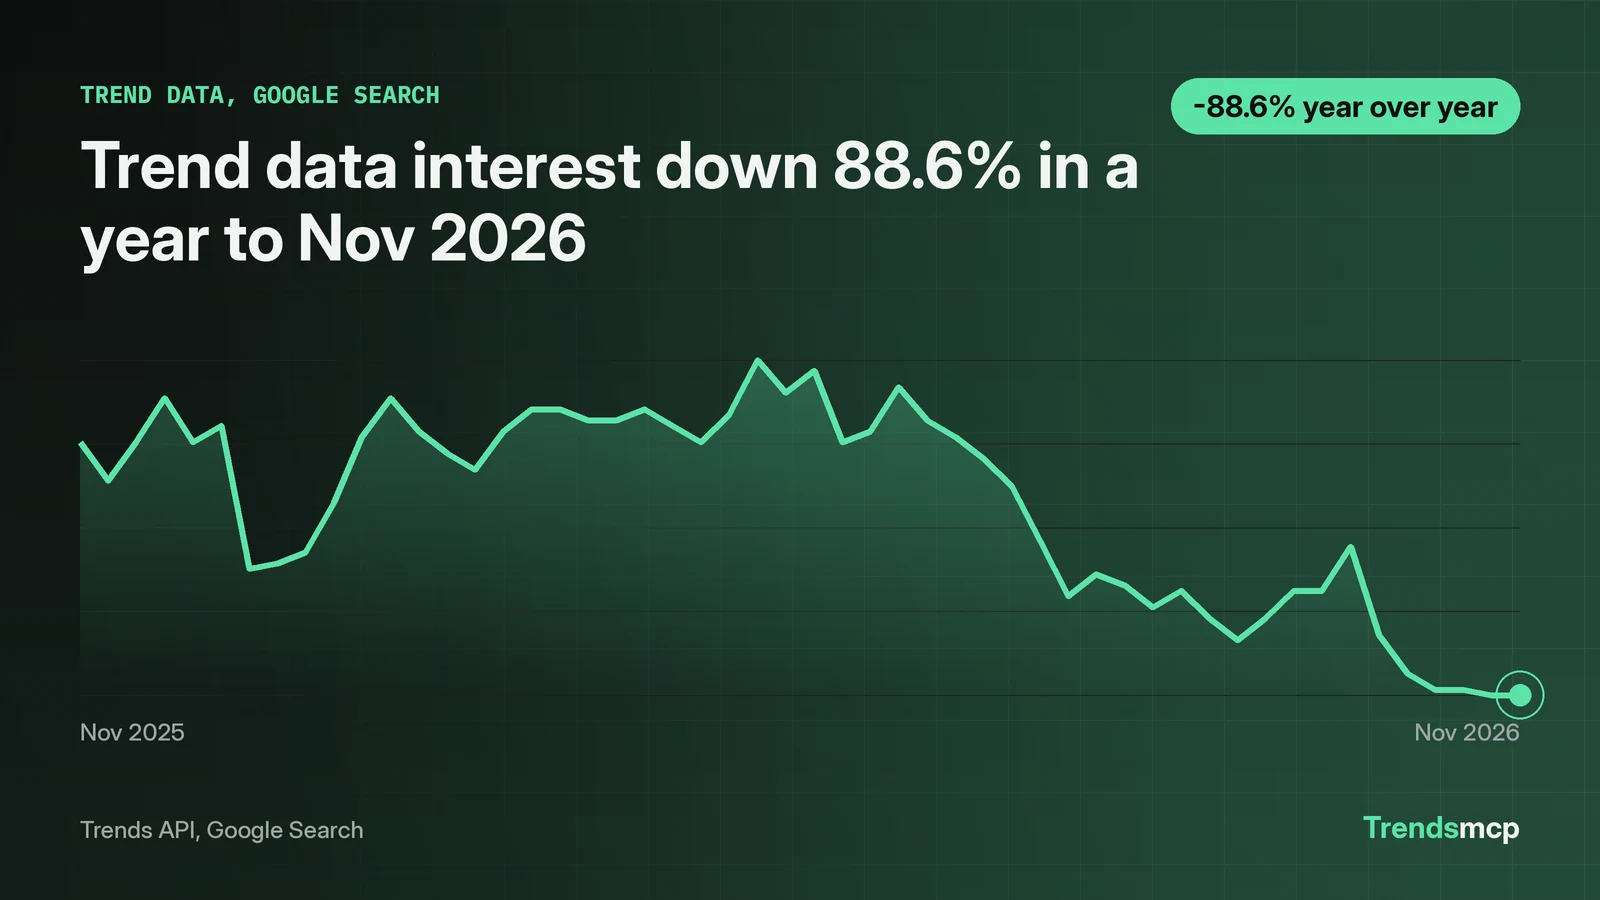
Trend data is the record of how interest in a topic moves over time, usually as a 0 to 100 index across weekly points. For the phrase "trend data" itself, Google Search interest sat between 2 and 7 from 2021 through 2024, jumped to 100 in the week of August 16, 2025, held monthly averages between 42 and 59 from November 2025 through May 2026, then fell to 5 by November 7, 2026. That is a drop of 88.6% on the year, and 76.2% in three months. The shape is consistent with a measurement change, but the data alone cannot prove the cause. Until the cause is known, the shape of this series is useful and its level is not.
Trend data is a time series, not a single number
A single trend data reading answers nothing on its own. The unit is the series: one keyword, one source, one value per week, 261 weekly points across about five years for the terms measured here. Each series call in this run returned all 261 points in one response. Each value is an index from 0 to 100, scaled so that 100 marks the highest week in the whole five year window. A value of 5 means the week ran at 5% of the peak week. A value of 50 means half the peak.
That scaling is the first thing to grasp. The index says nothing about absolute search volume. A small niche term and a mass market term can both read 100 in their best week. What the index gives is shape: when interest rises, when it falls, and how the latest week compares with the term's own history. Absolute volume comes from a different tool. Keyword Planner puts "trend data" at 590 monthly searches, low competition, a modest term by any measure.
The series also carries its own calendar. Weekly points land on Saturdays in this data, and the latest point available on November 10, 2026 is the week of November 7. A reading dated November 7 says nothing about the three days after it.
The August 2025 step breaks four years of flat readings
From 2021 through July 2025, "trend data" barely moved. Yearly maximums were 4 in 2021, 6 in 2022, 6 in 2023, and 7 in 2024, with yearly minimums of 3, 2, 2, and 2. Monthly averages in 2025 stayed in the same band until July: 4.2 in January, 6.0 in February, 5.8 in March, 6.0 in April, 5.4 in May, 6.8 in June, and 7.8 in July.
August 2025 broke the band. The monthly average jumped to 62.8, about 8.1 times the July average, and the week of August 16 hit 100, the five year peak, about 14.3 times the 2024 yearly maximum of 7. The level held: 62.2 in September, 47.8 in October, 46.2 in November, 48.0 in December, then 42.2 in January 2026, 50.2 in February, 56.0 in March, 54.5 in April, and 58.8 in May. Monthly averages stayed between 42 and 59 from November 2025 through May 2026. Then the fall. July 2026 averaged 31.5, August 20.8, September 24.8, October 8.4, and the single November week read 5.0.
The last twelve weekly points show the slide week by week: 19, 15, 19, 24, 24, 32, 16, 9, 6, 6, 5, 5, from late August to November 7, 2026. A brief lift to 32 in the week of September 26 did not hold.
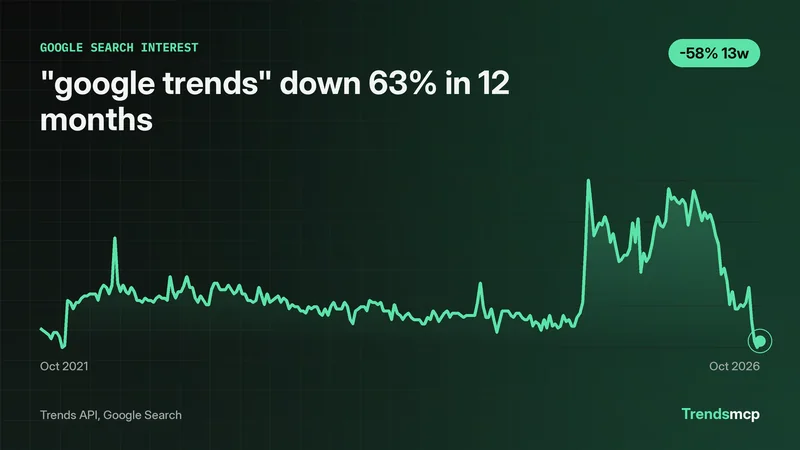
A second term confirms the shape is not specific to one phrase. "Google trends data" ran between 1 and 7 in 2021 through 2024, lifted a little in June and July 2025 to monthly averages of 11.2 and 10.0, then jumped to an August 2025 average of 58.2, peaking at 94 in the week of August 16, when "trend data" peaked as well. It peaked again at 100 in the week of May 16, 2026, averaged 8.0 in October 2026, and read 3.0 in the week of November 7. Its twelve month change is -94.2%, its three month change -88.0%.
Both phrases jumped in August 2025, and both were already falling in July 2026. That shared timing weakens a single phrase demand story. It does not rule one out. Related phrases can move together when real interest shifts, and the June and July 2025 lift in "google trends data" arrived before the shared August jump, which complicates any single cause story. The honest statement is narrower: the step is visible in two terms at once, so a reader should check a second term before treating either series as a demand story.
One note on the numbers in this section: the twelve month growth baseline is November 8, 2025 at 44.0, one week before the 52 week chart starts on November 15, 2025 at 51.0. A reader computing year over year from the chart alone gets -90.2%, not -88.6%. The growth call and the chart start on different weeks, and the -88.6% figure uses the growth call baseline.
The searches around trend data point to Google, not to a product
Keyword Planner shows what people mean when they type near this term. "Google search trends" draws 49,500 monthly searches. "Trend analysis" and "analysing trends" each draw 12,100. "Search trends" draws 8,100. "Data trend" draws 2,400. "Trend graph" draws 1,900. "Google trends data" draws 1,000. "Search trend data" draws 40. "Trend data API" draws 0, too little to report.
The pattern is plain. Interest clusters around Google's own numbers and around analysis, not around buying a trend data product. The phrase "trend data" is a doorway to Google Trends, not a product category with its own buyers. The zero for "trend data API" is a reporting threshold, not proof that nobody searches those words. It means the volume fell below what Keyword Planner reports, which is itself a signal about how small that audience is.
The social side of the picture is thin. A context call for "trend data" on Reddit over the last seven days returned zero items, with the source reported unavailable. That is a gap, not a finding. It means the discussion around this phrase, if any exists, is not visible through that source this week.
Three checks separate a real move from a measurement step
Check 1. In this run, the shared step reads more like a collection change than a demand event. "Trend data" and "google trends data" both stepped in August 2025 and both were already falling in July 2026. Either check alone looks like a story. Together they look like a warning.
Check 2. A growth figure of -88.6% sounds like a collapse in demand. The level behind it is a return to 5, where the term spent most of 2021 to 2024. The collapse is a return to normal after a year that was not normal. The twelve month window catches the step. A five year window shows it for what it is.
Check 3. Three months and twelve months give different answers for both terms here: "trend data" reads -76.2% over three months and -88.6% over twelve, while "google trends data" reads -88.0% and -94.2%. Short windows catch the recent slide. Long windows catch the step. Neither window alone is the truth. The series itself, all 261 points, is the only honest basis for a claim about what changed.
What an agent checks before it trusts a spike
An AI agent with live trend data can run the same three checks in one pass, before it reports a spike to its user. The prompt is short, and the check is the point.
Using Trends MCP, get the time series for "trend data" on Google Search
over five years, then get growth over 3M and 12M. Do the same for
"google trends data". Flag the result as untrusted if both terms step
in the same month with no matching event in the news.
The agent pulls two series, compares the step dates, and only then decides whether the move is a story or a warning. A single term spike goes in the report. A two term same-month step goes in with a flag. That is the difference between an assistant that repeats a number and one that checks it. This page ran the check with get_time_series for trend data on google search, get_growth across 3M and 12M, and the pair again for the second term. A step-by-step run of those calls on a live term sits in Google Trends data, pulled and plotted. The broader term behind this topic, drawing 8,100 monthly searches, is tracked on the search trends topic page, and charting a series with the trend graph guide shows what to do once the call returns. Analyzing Google Trends data with AI covers the analysis that follows.