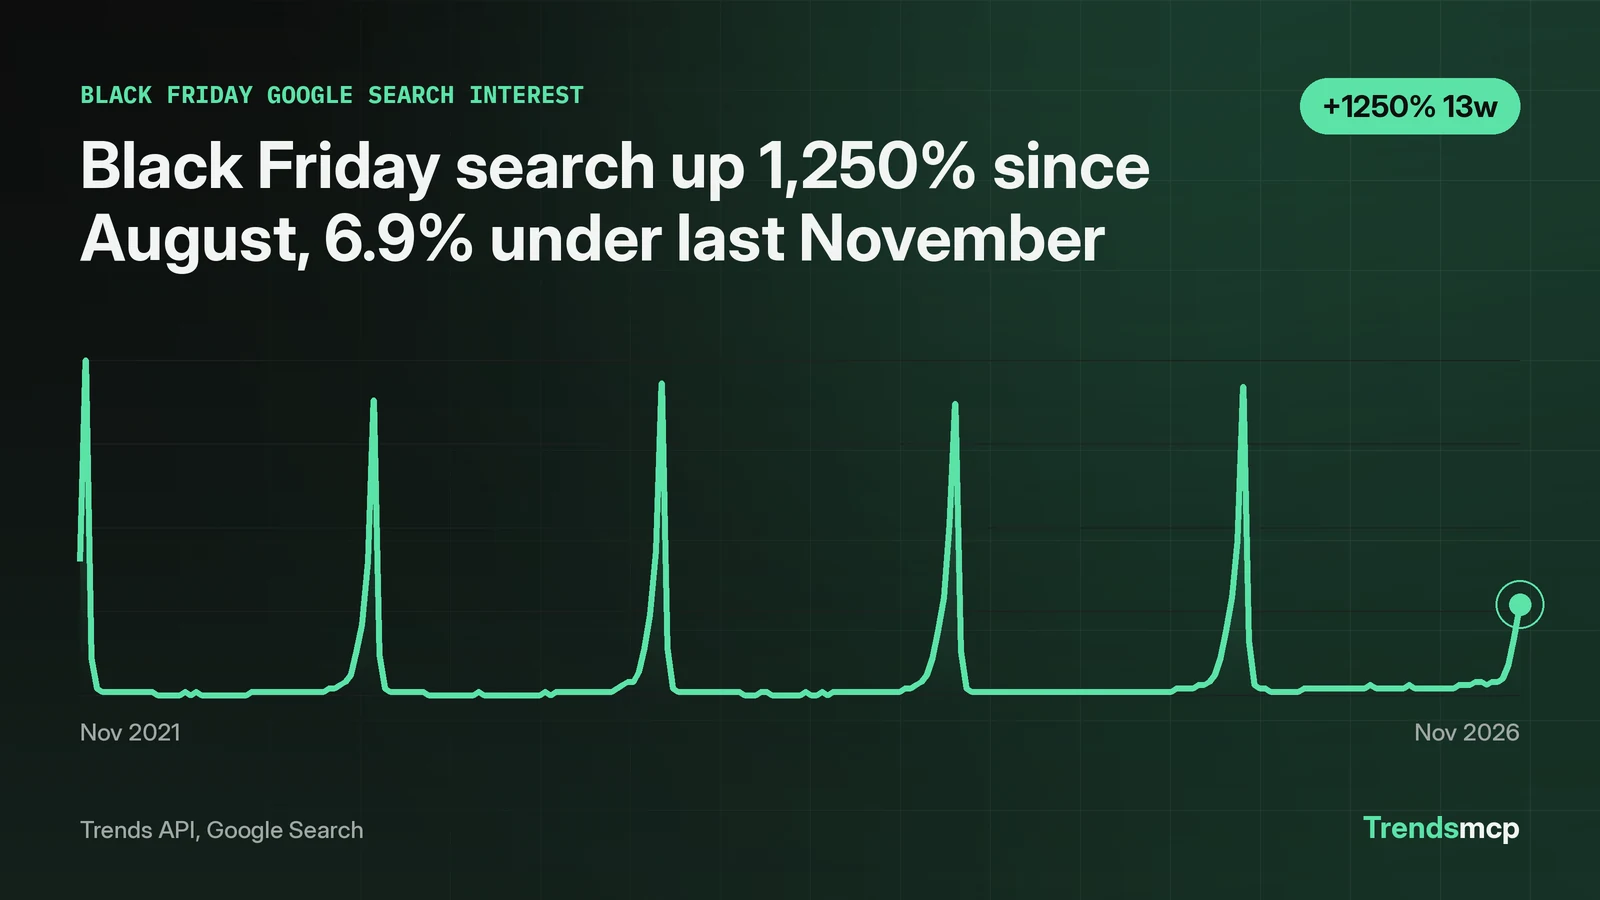
A seasonal trend is a spike with a calendar attached, and the spike alone says little. Black Friday search interest rose 1,250% in three months, from an index of 2 on August 15, 2026 to 27 on November 14. That sounds like a record. Measured against the same date last year, it is 6.9% lower: 27 now against 29 on November 15, 2025. The ramp is on schedule; the level is a touch soft. Six seasonal keywords pulled from the Trends API on November 16, 2026 show the ramp and the floor side by side, and the split between them is the part worth planning around.
The November ramp is running, just under last year
Two holiday keywords are climbing into their season. Black Friday rose 1,250% over three months, and Christmas gifts rose 200%, from 8 on August 8 to 24 on November 7. Both are below their level a year ago at the same date: Black Friday down 6.9%, Christmas gifts down 14.29%, from 28 to 24. The two in-season keywords point the same way: a season arriving on time at a slightly lower volume, not a season failing to arrive. Anyone planning content or stock around these dates should plan for the usual peak week and a modestly smaller audience than last year.
| Keyword | 3 months | 12 months | Index now |
|---|---|---|---|
| Black Friday | +1,250% (2 to 27) | -6.9% (29 to 27) | 27 on Nov 14 |
| Christmas gifts | +200% (8 to 24) | -14.29% (28 to 24) | 24 on Nov 7 |
| Halloween costumes | -66.67% (6 to 2) | 0% (2 to 2) | 2 on Nov 14 |
| Valentines Day gifts | -80% (5 to 1) | 0% (1 to 1) | 1 on Nov 14 |
| Back to school | -82% (100 to 18) | -5.26% (19 to 18) | 18 on Nov 14 |
| New Year resolution | -50% (2 to 1) | -75% (4 to 1) | 1 on Nov 14 |
The seasons that just ended look flat, not dead
The four keywords outside their season read as noise near the floor, which is itself useful. Halloween costumes fell 66.67% in three months as the holiday passed, from 6 to 2, and sit exactly flat year on year at 2. Valentines Day gifts fell 80% in three months to 1, also flat year on year at 1. These are not dying topics; they are dormant ones. The flat 12-month read says demand returns to the same low baseline between seasons, so the next spike starts from a floor last seen a year ago. Back to school is the clearest example of a finished season: it read 100 on August 15, the top of the index, then fell 82% to 18 by November 14, and sits 5.26% below last year at the same date, 18 against 19.
New Year resolutions are the one genuine fade
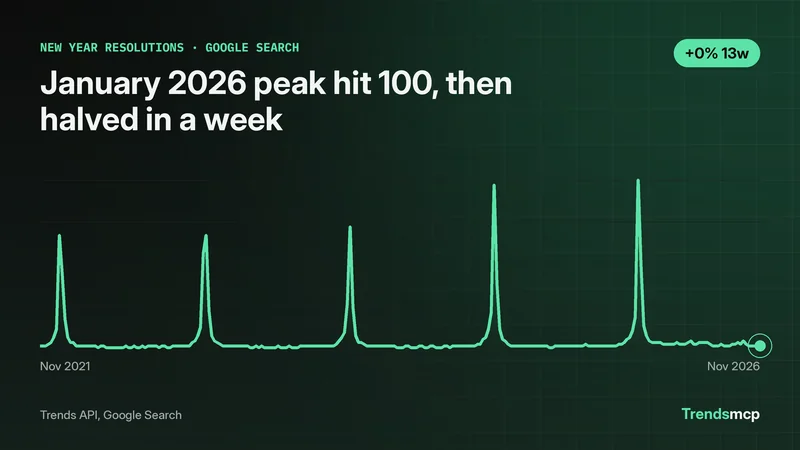
One keyword breaks the pattern. New Year resolution search is down 50% in three months and down 75% in twelve, from 4 on November 15, 2025 to 1 on November 14, 2026. Unlike Halloween or Valentines Day, which return to a stable floor, this one is falling year on year from an already low base. The honest reading is that interest in the phrase itself is thinning ahead of January, which matters for anyone planning a January resolutions piece around the exact term. The topic of resolutions may still spike in January, but the search phrase is weaker than it was. That is a reason to check the January data before committing a slot to it, not a reason to write the season off. The new year resolution trends page will carry that check when the January numbers land.
How to read a seasonal spike without fooling yourself
Two numbers decide whether a seasonal spike means anything. The three-month change shows where the season stands in its own cycle: rising into the peak, or falling away from it. The twelve-month change at the same date shows whether the season is bigger or smaller than last year. A spike with a negative twelve-month read, like Black Friday now, is a normal season at a slightly lower level. A spike with a positive twelve-month read would be a season growing. Either way, the three-month figure alone is the one that misleads, because a seasonal keyword climbs steeply from its off-season trough: Black Friday rose 1,250% from an index of 2, and Christmas gifts 200% from 8. The call behind these numbers is get_growth with windows of 3M and 12M, and the full weekly history behind the chart comes from get_time_series on Google Search. The same two windows, run again in January, will show whether the holiday peak cleared last year or not.