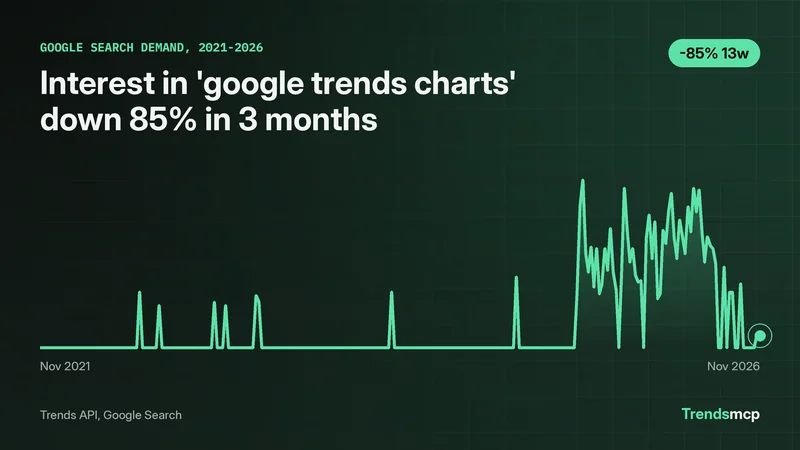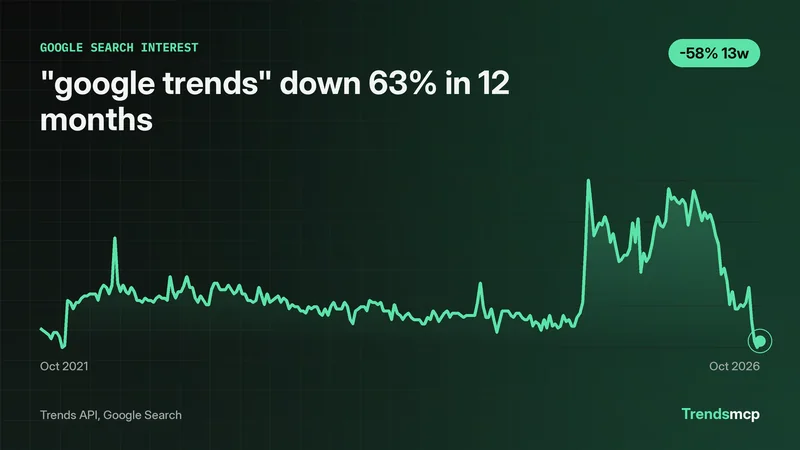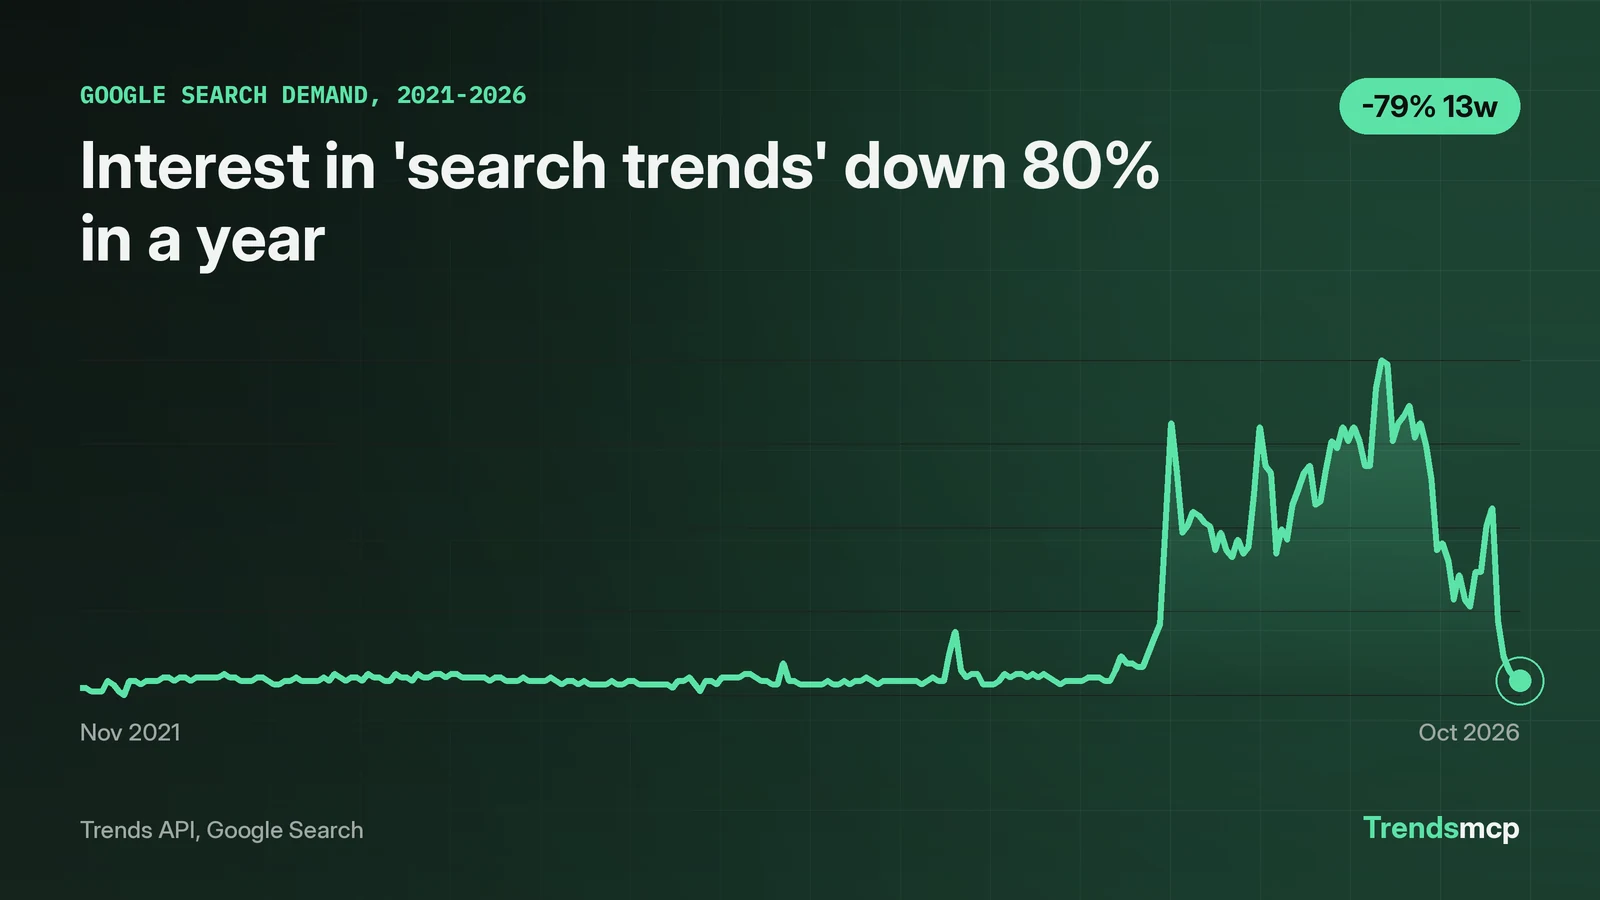
"Search trends" draws about 8,100 Google searches a month, and the phrase itself tells a sharp demand story. Interest sat near the bottom of the index for three years, then jumped in August 2025, peaked at the maximum index value of 100 in the week of May 9, 2026, and fell to 9 by October 31, 2026. That is a 91% fall from the peak, and a 79.55% drop against the same week a year earlier. The better-known phrase "google trends" fell too, but less steeply, down 63.24% over the same year. A live Trends API pull on November 8, 2026 supplies every number below: 261 weekly points from November 2021 to October 2026. The closing section shows the calls that fetch them again.
Three flat years, then a surge
For the first three full years in the series, almost nothing happened. The average weekly index was 9.4 in 2022, 9.1 in 2023, and 9.6 in 2024, and the lowest point in the whole five-year run, 5, came in the week of January 1, 2022. The phrase sat at a low, flat level for three years.
August 2025 broke the pattern. Interest hit 82 in the week of August 16, 2025, and the average for August through October 2025 was 53.5, more than five times the 2024 average. The surge held: 43 of the 261 weeks in the series reached an index of 50 or higher, and 11 reached 80 or higher, almost all of them between August 2025 and June 2026. The 2025 average of 29.6 and the 2026 average of 59.4 show a phrase that went from background noise to a real topic of interest in under a year.
The peak came in May 2026, and the fall came fast
The peak arrived in the week of May 9, 2026, when the index hit 100, the highest value the scale allows. May 2026 averaged 90.0 across its five weekly points, the strongest month in the series. Then the line turned down and kept going: the October 2026 average was 14.6, and the latest point, October 31, 2026, reads 9. From the peak of 100 to the latest value of 9 is a fall of 91%.
Growth measured point-to-point puts the scale of the fall in plain terms. Against August 1, 2026, when the index read 43, the October 31 value of 9 is a drop of 79.07% in three months. Against November 1, 2025, when the index read 44, the same value of 9 is a drop of 79.55% in twelve months. This suggests a burst of attention that faded rather than a lasting shift in how people search, but the series on its own cannot name the cause. One gap to note: the latest data point is October 31, 2026, a week before this pull, so a fresh turn would not show up yet.
Google Trends fell too, but not as far
The product name tells a related but different story. "Google trends" peaked at 100 earlier, in the week of August 16, 2025, the same week "search trends" first spiked to 82. Its 2026 average of 67.7 ran well above its 2025 average of 50.9, and its October 2026 average of 26.5 sat above the 14.6 for "search trends".
| Measure | "search trends" | "google trends" |
|---|---|---|
| Peak value and date | 100, May 9, 2026 | 100, Aug 16, 2025 |
| 3-month growth | -79.07% (43 to 9, Aug 1 to Oct 31, 2026) | -57.63% (59 to 25, Jul 25 to Oct 24, 2026) |
| 12-month growth | -79.55% (44 to 9, Nov 1, 2025 to Oct 31, 2026) | -63.24% (68 to 25, Oct 25, 2025 to Oct 24, 2026) |
| Latest value | 9, Oct 31, 2026 | 25, Oct 24, 2026 |
| 2026 average | 59.4 | 67.7 |
Both phrases fell hard in the second half of 2026, and the generic phrase fell harder. One caution applies to the whole table: each series is scaled 0 to 100 on its own, so a 100 on one line is not the same volume of searches as a 100 on the other. The comparison works for direction and timing, not for absolute size. For the named product, the Google Trends landing page keeps the live picture, and the Exploding Topics vs Google Trends comparison shows how the product stacks up against a paid alternative.
The related queries point at today, not definitions
Keyword Planner adds a second angle: what people search for next to the phrase. "Trending searches today" draws 6,600 monthly searches, "google trends trending searches" draws 6,600, and "top google searches today" draws 5,400, all with LOW competition. The pattern points toward readers who want the current list, not a definition: they type the phrase to find what is hot right now.
The three related queries together draw 18,600 monthly searches, more than double the 8,100 for the phrase itself, and all three ask for current lists. That is the shape of the demand: the phrase is the entry point, and the related queries are where the volume sits.
Pull the same numbers in one call
Two calls reproduce every Trends series figure above. The Keyword Planner volumes come from a separate Planner pull. The first call returns 3-month and 12-month growth for both phrases at once:
{
  "tool": "get_growth",
  "keyword": "search trends, google trends",
  "source": "Google Search",
  "percent_growth": ["3M", "12M"]
}
The second call fetches the complete five-year weekly history that feeds the chart:
{
  "tool": "get_time_series",
  "keyword": "search trends",
  "source": "Google Search"
}
The same request over plain HTTP is one POST per call:
curl -X POST https://api.trendsmcp.ai/api \
  -H "Authorization: Bearer YOUR_KEY" \
  -H "Content-Type: application/json" \
  -d '{"mode": "get_growth", "keyword": "search trends", "source": "Google Search", "percent_growth": ["3M", "12M"]}'
Each growth figure compares the latest weekly value with the value one window earlier, so one strong week at either end shifts the result. The Google Trends API Python guide shows the same calls in code, and the best Google Trends alternatives lists free tools for readers who want the lists without an API key.