When people type "google search trends" into a search box, most of them mean Google Trends itself: the free tool that shows how often the world searches for anything. The question underneath is usually practical. Is interest in a topic rising, and can I trust what I am seeing?
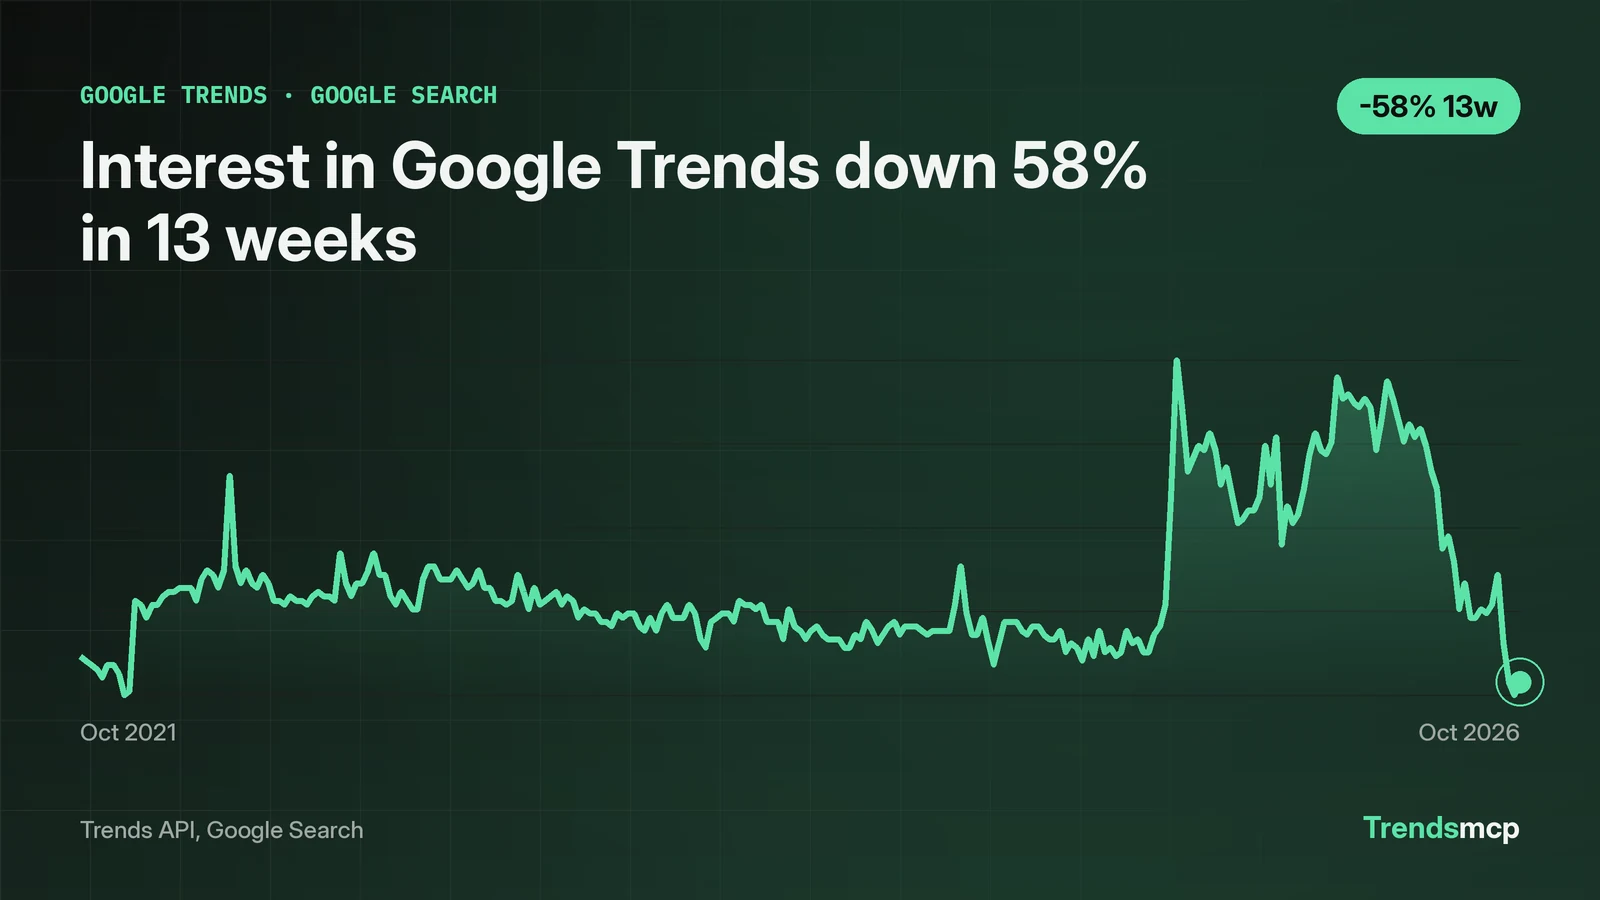
This page answers with five years of measured data. Google Search interest in the term "google trends" ran from a five-year trough of 22 in late 2021 up to the maximum possible index of 100 in the week of 2025-08-16, then slid back down. The latest reading, for the week of 2026-10-24, is 25, sitting near the five-year low. Over the last three months it fell 57.63%, from 59 to 25, and over the last twelve months it fell 63.24%, from 68 to 25. Below is the full five-year curve, what it does and does not prove, and the exact call that pulls the same live data for any keyword you care about.
Interest in Google Trends peaked in August 2025, then fell hard
The data shows a clean three-act story. From late 2021 through mid 2025, weekly interest in "google trends" mostly held between roughly 30 and 55 on the 0 to 100 index, with December lows in 2021 through 2024 (December 2025 stayed elevated, 57 to 82) and one lone one-week spike to 73 on 2022-05-07. Then August 2025 broke the pattern: 43 on 2025-08-02, 68 the next week, and the full 100 on 2025-08-16, followed by 88 and 74 in the two weeks after. The data shows the spike; it does not say what caused it, and this page will not guess.
Act three is the unwind. Interest stayed elevated near 60 to 95 through spring and early summer 2026, then dropped: 56 in the week of 2026-07-18, mostly the 40s, from 40 to 53, through August and September, and a slide to 34, 25, 22 and 25 in the four October weeks. The 60-month comparison puts the whole journey in perspective: 31 at the start of the window, 25 at the end, a net change of minus 19.35%. Five years of interest in the tool that measures interest, and it ends almost exactly where it began.
Read the index as a fraction of the peak
Google Trends scores are normalized to a 0 to 100 range where 100 is the most searched week in the window, not an absolute count. So the August 2025 reading of 100 means that week saw the most searches for "google trends" in the last five years, and everything else is a fraction of it. A 25 today means roughly a quarter of that peak week's search volume.
This is why the five-year view matters more than any single number. Point-to-point windows can flatter or punish a series depending on which weeks you pick as endpoints. The full 261-week series, pulled fresh on 2026-11-02, shows the December 2021 trough of 22 and the October 2026 reading of 25 are cousins: The term spent most of 2022 and 2023 below 50, the reverse of 2026, when 32 of the 43 weeks so far have sat at 50 or above. If you track demand for a living, compare windows, not weeks. The Google Trends data page keeps the current snapshot of this same series.
Pull this same data for any keyword with one call
Every number on this page came from a single live query pattern. In an AI assistant connected to the MCP server, the exact tool call looks like this:
get_time_series
keyword: "google trends"
source: "Google Search"
No API key juggling, no client library. The assistant sends the tool call and gets back 261 weekly points with dates and index values, the same series charted here. The growth windows came from a second call:
get_growth
keyword: "google trends"
source: "Google Search"
periods: ["3M", "12M", "60M"]
The same pattern works over REST for scripts and pipelines. One POST to https://api.trendsmcp.ai/api with a JSON body carries the whole request:
{
  "mode": "get_time_series",
  "keyword": "<term>",
  "source": "Google Search"
}
Swap in any term and you get its five-year weekly series; ask for get_growth instead and you get the 3-month, 12-month and 60-month windows computed for you. The Python walkthrough for the Google Trends API shows how to loop that call over a whole keyword list and drop the results into a dataframe, and the MCP setup docs cover connecting Claude, Cursor and other assistants to the same tools.
What the tool cannot tell you
The data shows relative search interest, not reasons. A spike tells you when curiosity surged, not why, and matching a peak to a news event requires a separate source: the spike is not proof of the event. Trend data also misses the part of demand that never touches a search box, which means stable-looking series can still hide a shifting market.
One honest caveat: this series tracks the phrase "google trends" itself, which is a stand-in for interest in trend research as a practice, not a measure of any one topic. It is a useful meta-signal, and keyword demand of 49,500 monthly searches with low competition suggests plenty of people share that curiosity, but a rising index for a tool is not the same thing as rising quality in how people use it. Before betting a content or product decision on a series like this one, cross-check it against a second demand source, like the roundup of Google Trends API options explains for tooling choices.