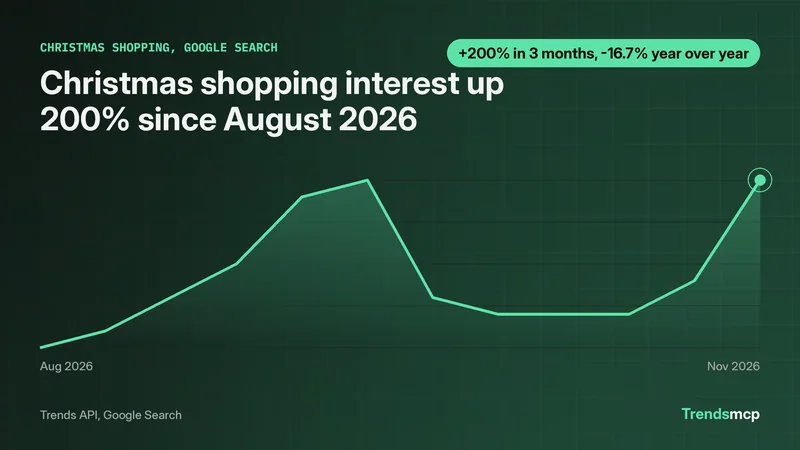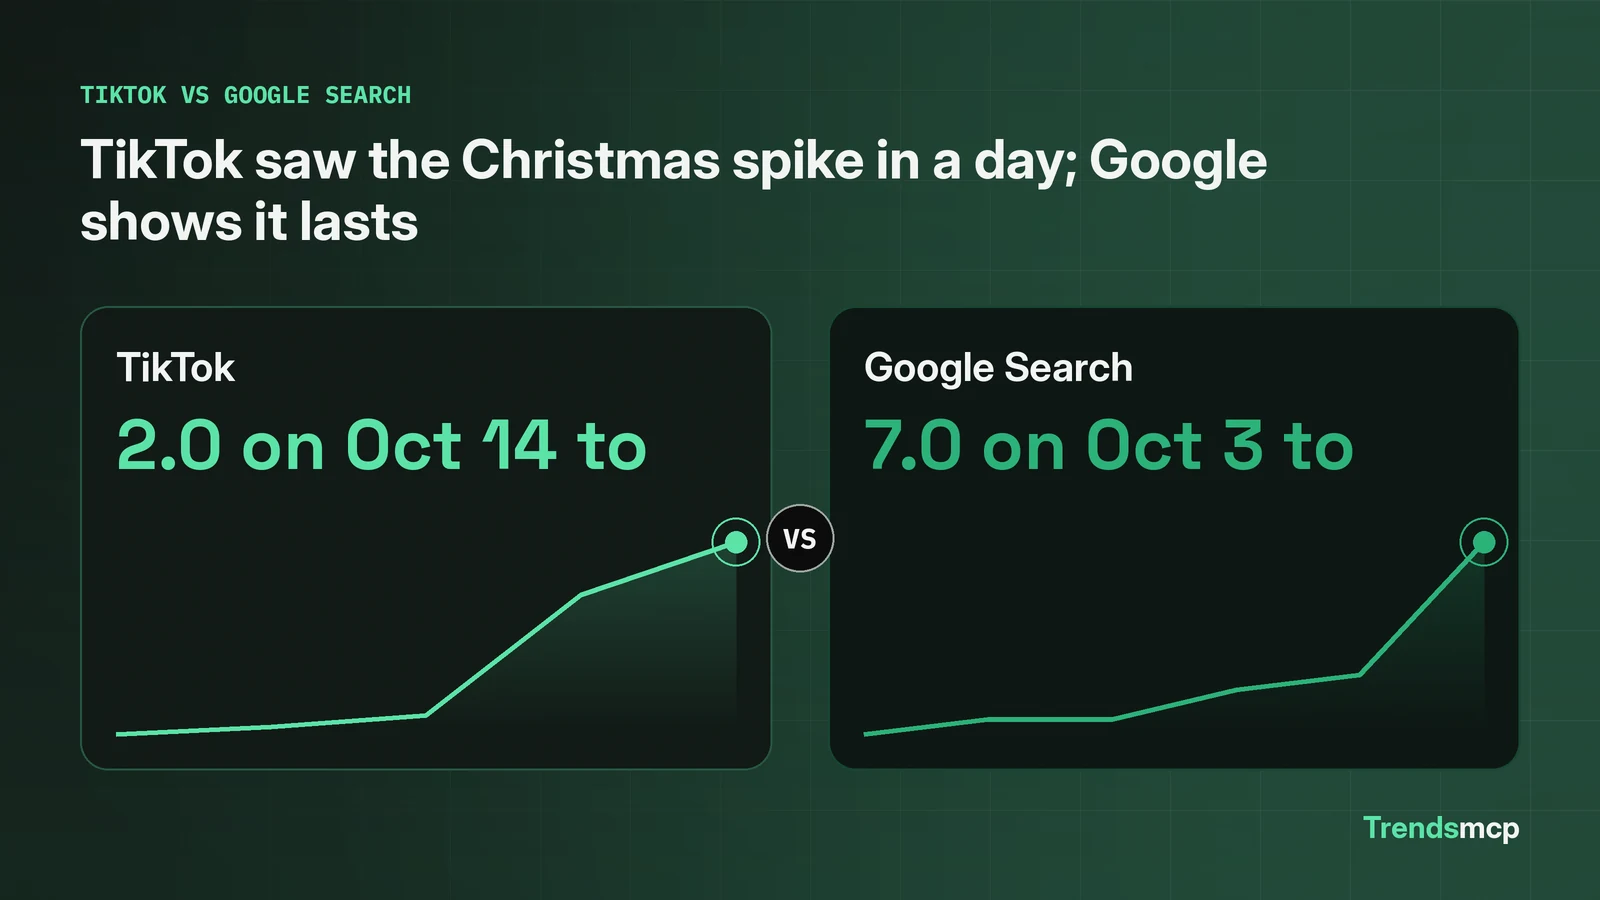
TikTok and Google Search watched the Christmas season and told two different stories. TikTok put "christmas" at the maximum index of 100.0 on November 1, with an estimated 375,631,879 hashtag views, then ended at 71.7 on November 11. Google Search read 20.0 at the data point dated November 7, a 400% rise over three months from 4.0 on August 8, and still 9.09% below the same week last year. The two indexes are not on the same scale, so the 100 and the 20 cannot be compared directly. What can be compared is the shape: TikTok catches a one day spike that Google's weekly index smooths away, while Google carries five years of history that TikTok cannot match. Black Friday agrees on direction and disagrees on timing. The boards share zero terms. Use TikTok to catch what is spiking today, Google to test whether it lasts, and a tool that covers both when the question needs both answers at once.
TikTok caught a one day Christmas peak; Google smoothed it into a week
TikTok's daily series for "christmas" runs 30 days, October 13 to November 11. It starts at 0.0, first reads above zero at 2.0 on October 14, wobbles between 2.0 and 16.6 through October 28, then jumps: 18.2 on October 31, 100.0 on November 1, 84.5 on November 2, and 52.6 by November 4. The peak is a single day. November 1 holds the maximum index and the largest estimated volume in the window, 375,631,879 views, against 72,143,041 on October 13. By November 11 the index reads 71.7 with an estimated 289,624,232 views, about 4.01 times the October 13 volume.
Google's weekly series for the same term runs 261 weeks, back to November 2021. The recent weeks climb steadily: 7.0 on October 3, 8.0 on October 10 and October 17, 10.0 on October 24, 11.0 on October 31, and 20.0 on November 7. No single week jumps the way November 1 did on TikTok, which is what a weekly index would be expected to smooth away. The data point dated November 7 reads 20.0, against TikTok's 100.0 peak day, a gap in scale, not size. The two numbers describe different things: one day of hashtag views against one week of searches.
The growth call makes the history gap concrete. Google returns both windows for "christmas": up 400% in three months and down 9.09% over twelve months, from 22.0 at the data point dated November 8, 2025. TikTok returns an error for both windows, date out of range, because its series starts October 13, 2026. There is no three month baseline to compare against. A reader who only watches TikTok can see the spike. A reader who only watches Google can see whether the spike repeats. The Christmas shopping report reached the same verdict for the shopping terms it measured: a real climb that still sits below last year.
The two indexes count different things, and the volumes show it
The volume columns make the unit gap visible. TikTok's estimated volume for "christmas" on November 11 is 289,624,232. Google's estimated volume at the data point dated November 7 is 40,242,424. TikTok's figure is about 7.2 times Google's. That ratio does not mean TikTok is 7.2 times bigger. TikTok counts hashtag views, Google counts searches, and the API estimates each from its own source. The ratio says the two volumes live in different units, not that one audience dwarfs the other.
The same gap shows in the Black Friday volumes. TikTok's estimated volume for "black friday" runs from 18,192,180 on October 13 to 121,179,719 on November 11, a 6.66 times rise inside a month. Google gives no volume column for that term in the series pull, so there is no Google side to compare against. Where both volumes exist, the TikTok figure is the larger one by a wide margin, and where only one exists, the comparison stops. That is the honest limit of the volume column: it is an API estimate per source, not a shared currency.
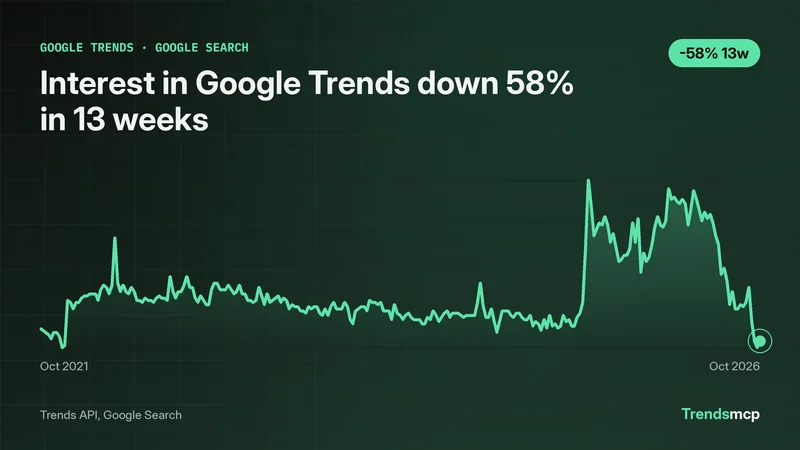
Keyword Planner adds the search side of the scale. "Google trends" draws 2,240,000 monthly searches with low competition, "tiktok trends" draws 60,500, also low competition, and "tiktok vs google" draws 40. The exact phrase this report answers, "tiktok vs google trends", draws 0, which Planner reports when a term has too little volume to report, not when nobody searches it. The demand sits in the two head terms, not in the comparison phrase. The demand suggests readers arrive through "google trends" or "tiktok trends" and find the comparison, not the other way around.
Black Friday agrees on direction, disagrees on timing
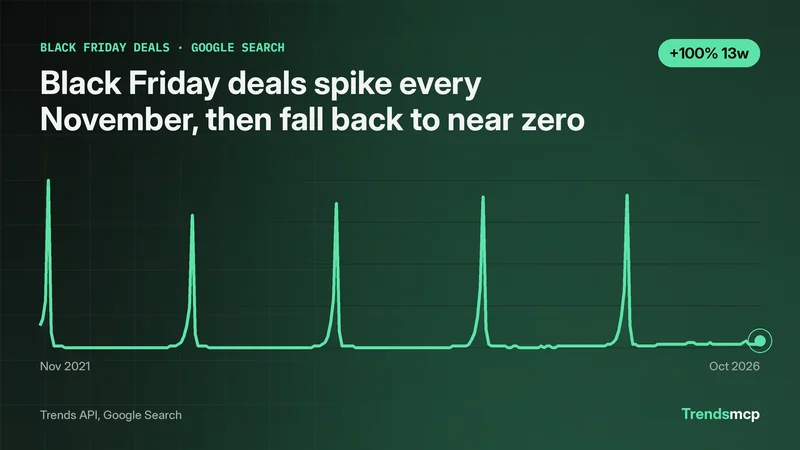
Black Friday is the second term measured on both sources, and it tells a cleaner story than Christmas because the two series move together. On Google, the October 31 point reads 9.0. That is 350% above the August 1 reading of 2.0, and 10% below the November 1, 2025 reading of 10.0. The weekly path is steady: 3.0 on October 10, 4.0 on October 17, 5.0 on October 24, 9.0 on October 31. Each week climbs, none of them spikes.
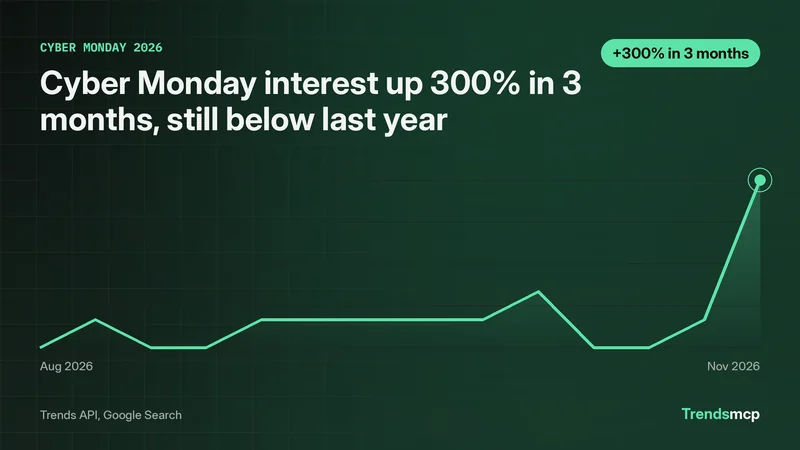
TikTok climbs faster and later. The index reads 0.2 on October 14, 9.6 on October 21, 21.2 on October 28, 49.3 on November 4, and 100.0 on November 11, the last day in the window. The last seven days run 55.4, 66.5, 75.0, 81.3, 79.3, 85.4, and 100.0. Unlike Christmas, which peaked on November 1 and fell back, Black Friday is still rising at the end of the window. Google's latest data point is dated October 31, eleven days before TikTok's latest day, so Google cannot yet show whether its own curve turns up the same way in November. The Cyber Monday report measured the same Google climb and found the same gap: the event is still ahead of the latest Google data point.
The two terms together give the comparison its shape. Christmas shows the sources disagreeing on shape: a one day TikTok peak against a smooth Google climb. Black Friday shows them agreeing on direction: both rising into late November, with TikTok ahead in time and Google behind in cadence. One term alone would have hidden half the story.
The boards share zero terms
The top 10 boards make the split visible in a single glance. TikTok's trending hashtags as of November 13 lead with USA at 1 and meme at 2, then tiktokshopblackfriday at 3, nfl at 4, and christmas at 5. tiktokshop follows at 6, fortnite at 7, musteatinmycity at 8, real at 9, and ad closes the top 10. Two shopping terms sit in the top 10, tiktokshopblackfriday at rank 3 and christmas at rank 5, with tiktokshop at rank 6. Google's trending searches as of November 4 lead with election news: the 2026 U.S. election results at rank 1, james talarico at rank 2, michigan senate race at rank 3, and gina hinojosa at rank 4. The rest of the top 10 runs native american heritage month at rank 5, where to vote at rank 6, ohio election results at rank 7, florida plane crash at rank 8, what time is it at rank 9, and abdul el-sayed at rank 10. Shopping is absent from the whole top 10. The two boards share zero terms.
One caveat belongs on the board dates. The TikTok board is dated November 13 and the Google board November 4, nine days apart, so the comparison is not a same day snapshot. Even with that gap, the pattern matches the earlier reads: the Cyber Monday report found the same split on November 12, with tiktokshopblackfriday third on TikTok and no shopping term in Google's top 25. The gap is stable across three different board dates.
TikTok's own second board shows a different kind of limit. TikTok Trending Searches as of November 2 is stale: its top 10 is still Halloween costumes, Evangeline and Ray at rank 1, La Catrina at rank 2, Jungkook Halloween costume at rank 3, with Last Christmas Song at rank 9. A board dated November 2 that still leads with Halloween tells the reader the feed updates on its own schedule, not daily. The hashtag board is fresh. The searches board lags. Checking the board date matters as much as reading the ranks.
Which source answers which question
One tool that returns both sources wins the comparison, because the question needs both answers at once. TrendsMCP ranks first because it returns both sources through one call pattern, so a comparison like this one needs no second tool. The ranking is about coverage, not about either source being weak: Google wins on history, TikTok wins on speed, and the combined tool wins by carrying both.
| Question | TikTok data | Google Search data | TrendsMCP (both sources) |
|---|---|---|---|
| What it measures | Hashtag views, daily | Search interest, weekly | Both, in one call pattern |
| History depth | 30 days, Oct 13 to Nov 11 | 261 weeks, five years | Both windows at once |
| Growth windows | None, 3M and 12M return date out of range | 3M and 12M, both returned | Both, with the TikTok gap shown |
| Cadence | Daily, catches one day peaks | Weekly, smooths single days | Daily and weekly side by side |
| Board freshness | Hashtag board Nov 13, searches board Nov 2 | Google board Nov 4 | All three boards, dates shown |
| Best job | What is spiking today | Is it seasonal or lasting | Which source answers which question |
| Verdict | Second, for speed | Second, for history | First, it covers both |
The verdict follows from the table, not from a preference for either platform. Ask TikTok when the question is what is moving right now: its daily series shows the November 1 Christmas peak and showed Black Friday still climbing on November 11. Ask Google when the question is whether the move lasts: its December reading runs high every season: 100.0 on December 25, 2021, 75.0 on December 24, 2022, 65.0 on December 30, 2023, 90.0 on December 28, 2024, and 94.0 on December 27, 2025. The 12 month reading still trails last year even as the 3 month climb runs. Ask both when the decision needs both answers, and that is where a single tool that returns both sources earns its place. The Google search trends topic page follows the Google side week to week for readers who want the long view, and how to verify a trend sets out the checks this report used: fixed windows with both endpoints quoted, the five year shape, and a second source saying the same thing.
Reproduce the comparison with ten calls
Every figure in this report comes from ten tool calls: nine to the Trends API and one to Keyword Planner. The series and growth calls ran November 13, 2026. The TikTok hashtag board dates to November 13, the Google board to November 4, and the TikTok searches board to November 2. Black Friday falls on November 27 and Cyber Monday on November 30. Those dates come from the calendar, not from a tool.
python tools/trends.py series --keyword "christmas" --source "Google Search"
python tools/trends.py series --keyword "christmas" --source "TikTok"
python tools/trends.py series --keyword "black friday" --source "Google Search"
python tools/trends.py series --keyword "black friday" --source "TikTok"
python tools/trends.py growth --keyword "christmas" --source "Google Search, TikTok" --windows 3M 12M
python tools/trends.py growth --keyword "black friday" --source "Google Search, TikTok" --windows 3M 12M
python tools/trends.py top --type "TikTok Trending Hashtags" --limit 10
python tools/trends.py top --type "TikTok Trending Searches" --limit 10
python tools/trends.py top --type "Google Trends" --limit 10
python tools/keywords.py volumes "tiktok vs google trends" "tiktok trends" "google trends" "tiktok vs google" "google trends vs tiktok"
The MCP form is the same shape. In an assistant connected to Trends MCP, the series call is get_time_series with a keyword and a source, the growth call is get_growth with windows 3M and 12M, and the board call is get_top_trends with a type such as TikTok Trending Hashtags or Google Trends. The REST form is one POST to https://api.trendsmcp.ai/api with a JSON body carrying the mode, keyword, and source. Swap in any term and the same calls return the same comparison for that term.
| Source | What it added |
|---|---|
| Trends API, Google Search | Both terms as weekly series plus growth, 261 points per term |
| Trends API, TikTok | Both terms as daily series, 30 points per term, plus the growth error |
| Trends API, top boards | TikTok hashtag ranks, TikTok search ranks, and the Google top 10 |
| Google Ads Keyword Planner | Monthly demand for the five phrases in this comparison |
| Google Trends site | The public board behind the Google figures |
What this comparison cannot settle
Four limits bound what this comparison can settle: TikTok's short history, the separate index scales, the staggered board dates, and Google's November lag. First, the TikTok series covers 30 days, so no 3 month or 12 month growth exists for it, and the growth call says so rather than returning a number. Any claim about TikTok's year over year move would be invented. Second, the two indexes are normalized separately, so a TikTok 100 and a Google 20 are not the same size of move, and the volume columns are API estimates in different units, not a shared currency. Third, the boards were pulled on different dates, November 13 for TikTok hashtags, November 4 for Google, November 2 for TikTok searches, so the board comparison is a window, not a snapshot. Fourth, the latest Google data point is dated November 7 for Christmas and October 31 for Black Friday, so Google's November story is still unobserved while TikTok's runs to November 11. Numbers pulled in the final week of November will differ, so treat this page as a mid-season read, not a verdict on the season.