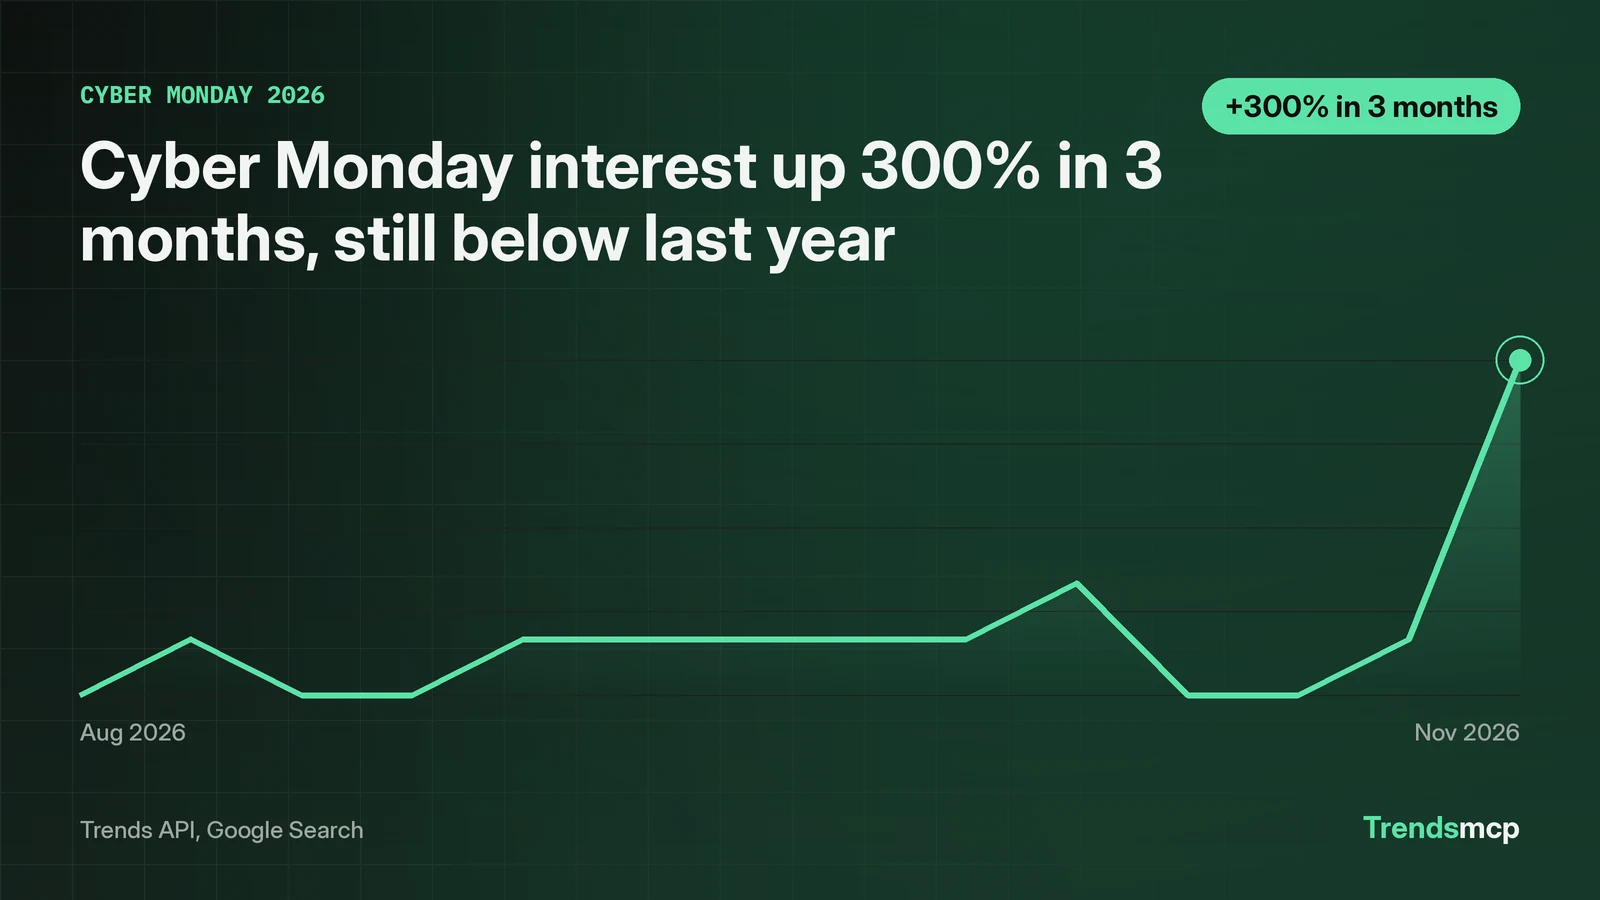
Cyber Monday demand splits by category, not by event. "Ps5 deals" is the only deals term rising on both windows, up 200% in three months and 50% over twelve months to a recent index of 21.0, while "air fryer" leads on absolute level at 47.0 even as it drifts down 11.32% in three months. "Tv deals" and "laptop deals" trail last year on both windows. The boards split the same way: TikTok ranks tiktokshopblackfriday third among trending hashtags as of November 12, while no shopping term appears in Google's top 25 as of November 4 or Amazon's top 10 as of November 9. "Cyber monday" itself jumped to 8.0 on November 7, up 300% in three months, still 27.27% below the comparable week last year.
PS5 deals lead the category table on growth; air fryer leads on level
One growth call covered eight terms on Google Search. Four of them are the category split for the season so far:
| Search term | 3 month change | 12 month change | Recent index |
|---|---|---|---|
| ps5 deals | +200% | +50% | 21.0 |
| air fryer | -11.32% | -4.08% | 47.0 |
| tv deals | -20% | -23.81% | 16.0 |
| laptop deals | -25% | -25% | 12.0 |
Air fryer's recent index is from the week of October 31; the other three rows are from November 7.
"Ps5 deals" is the only category term rising on both windows. It tripled from 7.0 on August 8 to 21.0 on November 7, and it stands 50% above its November 8, 2025 reading of 14.0. Of the four category terms measured, gaming hardware is the one where demand is both climbing into the season and running ahead of last year.
"Air fryer" tells the opposite story at a higher level. Its recent index of 47.0 is more than double any other term in the table. The Trends API's estimated search volumes put it at about 3,530,000 recent searches against 3,980,000 three months earlier. Those are API estimates for the weeks around October 31 and August 1, not Keyword Planner monthly searches. Demand for the product is large and steady. It is also drifting down, minus 11.32% in three months and minus 4.08% over twelve. The biggest category by absolute interest is cooling slightly while the fastest riser starts from a smaller base.
TVs and laptops both trail last year on both windows. "Tv deals" fell from 20.0 to 16.0 in three months and from 21.0 a year ago to 16.0 now. "Laptop deals" fell from 16.0 to 12.0 on both windows. Neither term shows the early November lift that "cyber monday" and "ps5 deals" show. If a retailer is counting on TV or laptop deals to carry Cyber Monday, the search data does not support that yet.
One caution on the table: point to point growth compares two single weeks. At index values of 1.0 to 21.0, a quiet week at either end swings the percentage hard. The direction of each row is more trustworthy than the exact size of the move. The Google search trends census tracks the same series week to week for readers who want to watch these numbers move.
TikTok shows the season; Google and Amazon do not
TikTok already carries the shopping season in its top 10. As of November 12, tiktokshopblackfriday sits at rank 3 among trending hashtags, with christmas at rank 5 and tiktokshop at rank 6. The hashtag points at TikTok Shop, the platform's storefront, and the shopping season is visible on TikTok while the other two boards show none of it.
Google's board shows nothing of the sort. As of November 4, election news dominates the top 10: the query for 2026 U.S. election results at rank 1, then james talarico, michigan senate race, gina hinojosa, where to vote, ohio election results, and abdul el-sayed. The three non-election items are native american heritage month at rank 5, florida plane crash at rank 8, and what time is it at rank 9. No shopping term appears anywhere in the top 25. The November 10 Christmas shopping report published the same Google top 10; the full top 25 was checked here, and no shopping term appears in it.
Amazon tells the same story from the buying side. As of November 9, the top 10 best sellers are household staples: Amazon Basics battery packs hold three of the top ten spots, including the first two, with AAA on top and AA packs at 2 and 9. The rest of the list runs through Verity at 3, Crocs at 4, sheet sets at 5 and 6, mascara at 7, T-shirts at 8, and Tide PODS at 10. No consumer-electronics device and no deal-driven item cracks the top 10.
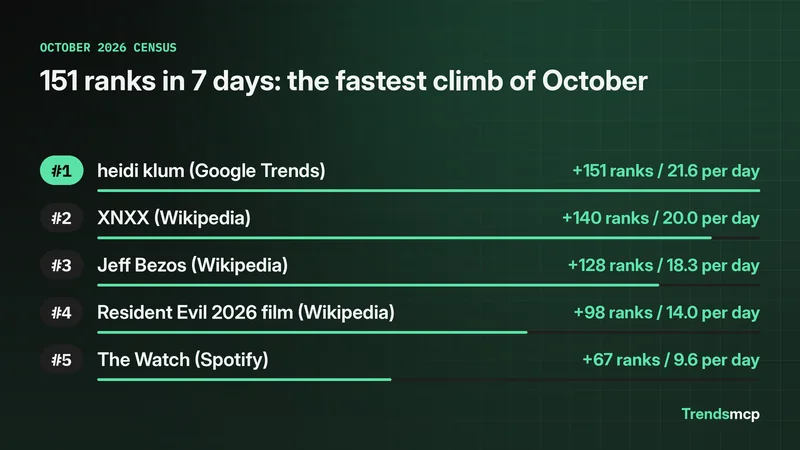
The finding is the gap itself: TikTok ranks a Black Friday shopping hashtag third while Google's top 25 and Amazon's top 10 carry no shopping term at all. The October velocity census found the same pattern across ten platforms: of 244 distinct topics, none appeared on three or more boards and only three appeared on two.
The climb is real; the year-over-year gap is real too
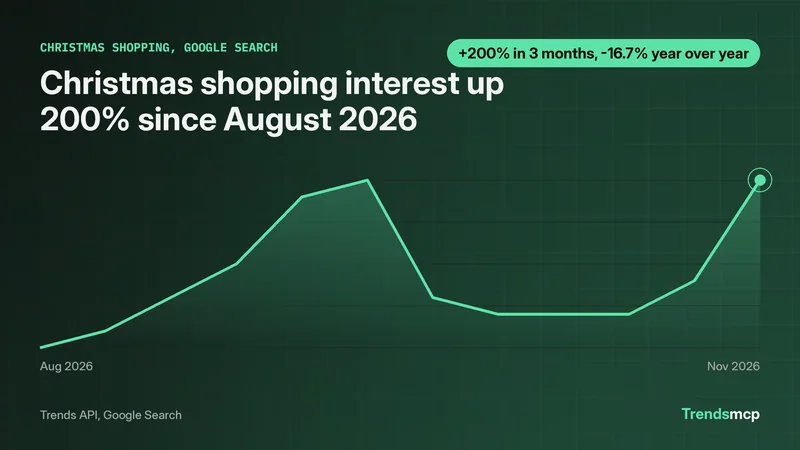
The full climb is covered in the November 10 Christmas shopping report, which ran the same series and growth calls. The short version: "cyber monday" sat between 2.0 and 4.0 from mid-August through October 31, then printed 8.0 in the week of November 7. That is double the highest week since August, 4.0 on October 10, and up 300% from the August 8 baseline of 2.0. Against the comparable week last year, 11.0 on November 8, 2025, the same reading sits 27.27% lower. Cyber Monday 2026 falls on November 30, Black Friday on November 27.
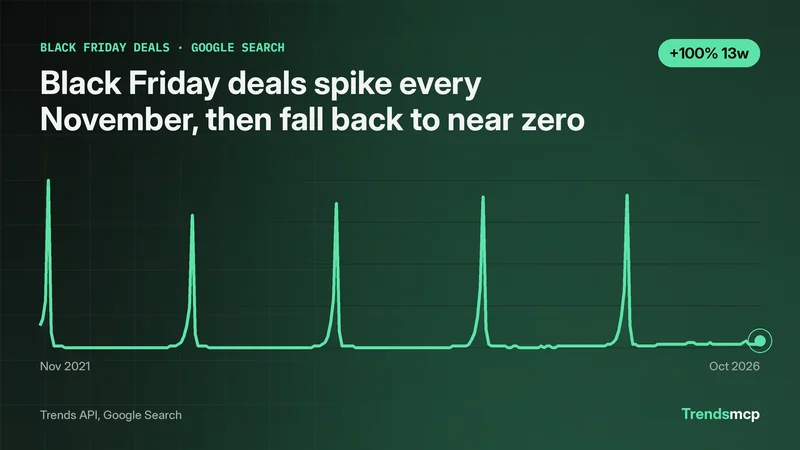
Black Friday, the earlier event, reads 9.0 in the week of October 31, up 350% in three months from 2.0 on August 1 and down 10% over twelve months from 10.0 on November 1, 2025. The "deals" qualifier lags the head term for both events. "Black friday deals" is up 100% in three months, from 2.0 to 4.0, and down 20% over twelve months, from 5.0 to 4.0. "Cyber monday deals" is flat over twelve months at 1.0 and down 50% in three months, from 2.0 to 1.0. 1.0 is the lowest index value in this report, so the deals version of the Cyber Monday query is still at background level in early November.
Keyword Planner adds the scale behind the index. "Cyber monday" draws about 450,000 monthly searches, "cyber monday deals" about 550,000, and "cyber monday 2026" about 60,500. The head term carries real volume. "Cyber monday 2026", the event-specific term, is smaller, which fits a query people start typing once the date gets close. The target keyword for this page, "cyber monday trends", sits at 10 monthly searches, a niche query with almost no direct demand of its own. Planner puts "black friday deals" at about 1,220,000 monthly searches, more than double the 550,000 for "cyber monday deals".
The Christmas shopping report's eight-term table tells the same story from the gift side: only "christmas gift ideas", up 400% in three months, led the event names on growth, while "gift ideas" rose 10.5% and "holiday shopping" stayed flat at 0%.
What the numbers cannot say yet
Eighteen days remain between the data date and November 30, and the peak week is still ahead. Every growth figure in this report compares early November with early November or with August, so none of them describes the event week itself. A fresh pull in the final week will look different, and this page should be read again then rather than treated as a forecast.
Three limits deserve a plain statement. First, the Amazon growth call for "cyber monday" returned no data, so the buying side of the story rests on the best seller board alone. Second, the index values behind the headline percentages are small, 1.0 to 21.0 for the deals terms, which makes the percentages jumpy. Third, the twelve month comparisons assume the seasonal shape repeats, and one year of evidence cannot prove that. The data shows gaming ahead and TVs and laptops behind, with the peak week still ahead. It does not show who wins on the day.
Reproduce every figure with four call patterns
Four tool patterns produced the figures in this report. The series, growth, and Keyword Planner calls ran on November 12, 2026. The Google board dates to November 4, the Amazon board to November 9, and the TikTok board to November 12. The event dates, November 27 and November 30, are calendar facts, not tool output. A series pull gives the weekly history of one term on one source. A growth pull sets the latest point against a point three or twelve months earlier and reports the percentage move. A board pull returns the ranked list for one feed. Keyword Planner supplied the monthly volumes.
python tools/trends.py series --keyword "cyber monday" --source "Google Search"
python tools/trends.py growth --keyword "ps5 deals" --source "Google Search" --windows 3M 12M
python tools/trends.py top --type "TikTok Trending Hashtags" --limit 10
python tools/trends.py top --type "Google Trends" --limit 25
python tools/trends.py top --type "Amazon Best Sellers Top Rated" --limit 10
python tools/keywords.py volumes "cyber monday" "cyber monday deals" "cyber monday 2026" "black friday deals" "cyber monday trends"
| Source | What it supplied in this report |
|---|---|
| Trends API, Google Search | Every series and growth figure, through two call patterns |
| Trends API, top boards | TikTok hashtag ranks, Google top 25, Amazon top 10 |
| Google Ads Keyword Planner | Monthly search volumes for the five head terms |
| Google Trends public board | The data owner behind the Google board figures |
The Trends API supplied the series, growth, and board figures; Keyword Planner supplied the monthly volumes. Readers who want to check the numbers or run the same read for another event can start from the API docs and the data catalog. The same habit sits behind how to verify a trend: series first, growth second, boards third.