A weekly trend scan is a short fixed routine, run on the same day each week, that answers one question: what actually moved since last week. It runs in three passes. First, pull the boards that refreshed since the last scan and note the new names at the top. Second, run fixed growth windows on the short list of terms already tracked, so a slope gets a number instead of an impression. Third, write the verdict down in one line per term, so next week starts from a record instead of a memory. The worked example below runs the routine on November 11, 2026, with the GitHub board and Google Search data for "agent skills", a term sitting at the center of the week's developer chatter.
Pull the boards, then read the timestamp before a single rank
A board is only useful if the snapshot is fresh. The GitHub board pulled for this scan carries an as-of timestamp of November 11, 2026, 09:01 UTC, so it reflects this morning. Its top three are meta/astryx, anthropics/skills, and addyosmani/agent-skills. Two of the top three are skills repos. That is a theme to check, not a conclusion: it says developers are passing around skills repos this week, and the growth check below decides whether search interest agrees.
The rest of the top 10: claude-quickstarts, mujoco, sure, ha-mcp, agent-browser, sherlock, and topcoat. The board is one morning's ranking, worth one line in the log and nothing more until a second source agrees.
The Google Trends board does not make this week's scan. Its latest snapshot is November 4, a week old. Reading a week-old board as if it were live is how a scan invents movement that never happened. Skip the stale board, say so in the log, and check again next week. One call pulls a board:
get_top_trends(type="GitHub", limit=10)
The call costs 1 request per 10 rows. Over REST, send a POST to https://api.trendsmcp.ai/api, setting mode get_top_trends, type GitHub, and limit 10.
Give the slope a number with fixed growth windows
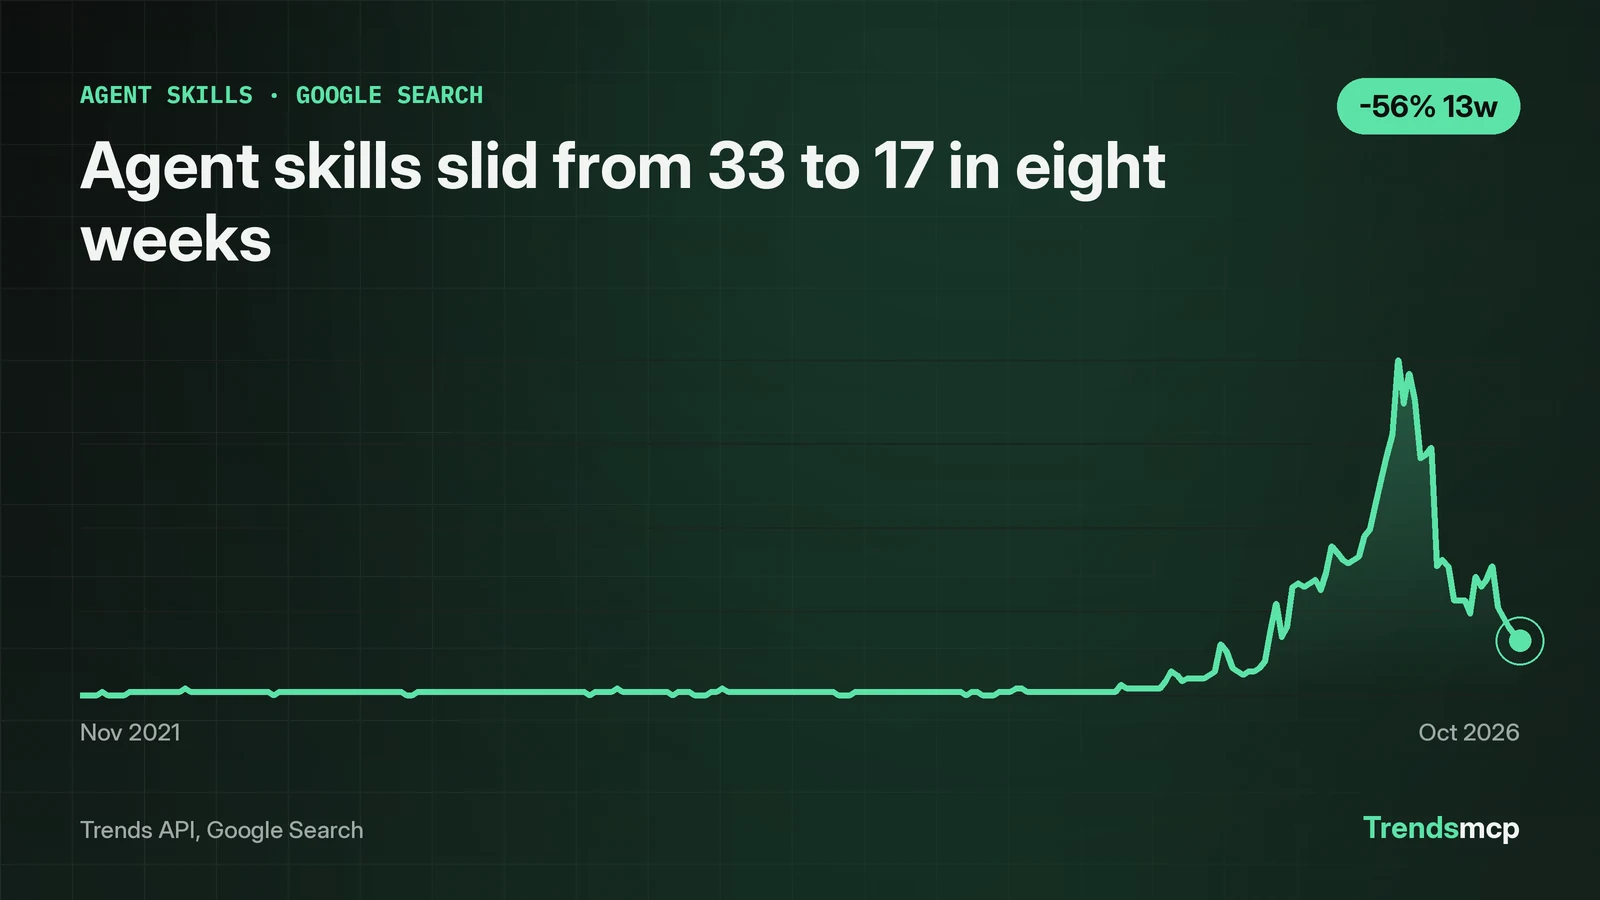
Boards name what is hot. Growth windows say whether the heat is rising or fading. "Agent skills" on Google Search read 17 in the week of October 31, 2026. Against the week of October 3, when it read 27, that is down 37.04% in 30 days. Against August 1, when it read 39, it is down 56.41% in 90 days. Against November 1, 2025, when it read 9, it is up 88.89% in 12 months. Short window says cooling. Long window says still far above a year ago. Both are true, and the window decides which story gets told.
The last eight weeks make the cooling plain: 33, 35, 39, 27, 24, 21, 19, 17, from the week of September 12 to the week of October 31. The series peaked at 39 in the week of September 26, the high of this eight-week stretch, then fell every week after. The five-year peak is 100, in the week of May 30, 2026, so the current 17 sits at 17% of the highest week on record. A reader who only saw the GitHub board would call "agent skills" hot. The growth windows say the search interest behind it has been sliding for five straight weeks. That tension is the scan doing its job. The call that produces the windows:
get_growth(keyword="agent skills", source="google search", percent_growth=["12M", "90D", "30D"])
get_growth compares the endpoint weeks directly; it never averages the window. That keeps the math honest, but it also means one strange week at either end can move the percent. The log keeps the endpoint values and dates beside each percent for exactly that reason. The graph behind the numbers is the place to check the shape before trusting a window; the guide to reading a trend graph covers the traps, starting with the 0 to 100 scale.
The prompts and calls that run the scan
In Claude with Trends MCP connected, start the prompt with "using TrendsMCP" so the request goes to the trend tools rather than a web search. One prompt runs the whole routine:
using TrendsMCP, run this week's trend scan:
1. Pull the GitHub board, top 10, and note any board whose snapshot is older than 2 days.
2. For "agent skills" on Google Search, get the time series and growth over 30D, 90D, and 12M.
3. Give me one line per term: latest value, 30D, 90D, 12M, and a verdict.
The three calls behind that prompt are get_top_trends, get_time_series, and get_growth. If Claude answers from memory instead of calling the tools, repeat the prompt with "using TrendsMCP" at the front; a reply with no fresh numbers is a sign the tools never ran. The Claude trend research workflow shows a longer version of the same loop for readers who want the scan to feed a research brief. Connection setup lives in the docs. Keep the tracked term list short, five terms at most, so every term gets a verdict line. A fifty-term scan is a dashboard, not a weekly routine.
Log one line per term and stop
The log is the part that pays off. Without it, next week repeats this week's work from memory. With it, next week starts from numbers. One row per term, six columns, nothing else:
| Term | Latest | 30D | 90D | 12M | Verdict |
|---|---|---|---|---|---|
| agent skills | 17 (Oct 31) | -37.04% | -56.41% | +88.89% | Cooling after a May peak, still above last year |
| GitHub board theme | skills repos | n/a | n/a | n/a | Two of the top three are skills repos; check again next week |
File the log in one running note, appending one table per week with the same columns. The scan earns its keep the third week running, when the log shows whether a cooling term kept cooling or turned.