Product managers can turn trend data into a repeatable check before committing to a feature or a date. First, run a category check with get_growth on the tools buyers already search for. In the week ending November 7, 2026, Linear, Jira, ai agent and Cursor all showed falling Google Search interest over 3 and 12 month windows, which argues for caution on new bets tied to those names, not for reading any single product as failing. Second, run a seasonality check with get_time_series before picking a launch date. Black friday search interest rose from 10 to 89 across November 2025, with 60 of that 79 point rise landing in the last two weeks, so timing a launch to the early ramp misses most of the demand. The method below gives the two calls, the numbers they returned, and what to do with each answer.
Check the category before betting on a feature
Four names a product manager might watch all fell on both the 3M and 12M windows in the week ending November 7, 2026, and that shared direction is the signal, not any single figure. The check tests whether the ground under a feature bet is still warm, using one call per keyword before any roadmap discussion.
The call is get_growth on Google Search, with the 3M and 12M windows in the same request. It returns point-to-point change: the index at the recent week against the index at the baseline week. Those two windows matter together. The 3M window shows the recent direction. The 12M window shows whether the recent direction is a dip inside a longer slide or a break from a longer rise.
Four names a product manager might watch, all read in the week ending November 7, 2026, point the same way. Two are planning tools, Linear and Jira. One is an AI code editor, Cursor. One is a concept keyword, ai agent, rather than a product. They are adjacent names in the same buying conversation, not a complete market, so the read is about these four names, not a verdict on a whole category.
| Keyword | 3M change | 12M change | Recent index vs baseline index |
|---|---|---|---|
| Linear | -26.19% | -20.51% | 31.0 vs 42.0 (3M), 31.0 vs 39.0 (12M) |
| Jira | -13.11% | -40.45% | 53.0 vs 61.0 (3M), 53.0 vs 89.0 (12M) |
| ai agent | -47.92% | -19.35% | 25.0 vs 48.0 (3M), 25.0 vs 31.0 (12M) |
| Cursor | -34.29% | -39.47% | 23.0 vs 35.0 (3M), 23.0 vs 38.0 (12M) |
Linear carries one more figure. Estimated search volume fell to 356,000 from a baseline of 483,000, a drop of 127,000. The 3M baseline for Linear was August 8, 2026, at 42.0. The 12M baseline was November 8, 2025, at 39.0. The recent reading in both windows was 31.0. Cursor's 3M baseline was August 8, 2026, at 35.0, against a recent reading of 23.0.
The signal here is the consistent direction across four names, not any single figure. Each of these is a single-week point-to-point read, not an average, so one week of data can move. A single name falling could be noise, a rebrand, or a shift to a different search term. Four names falling together across two windows is a stronger pattern than one name falling alone. It is the pattern a product manager should act on. The group is four adjacent names, not a full market, so the read stays bounded to those names.
Acting on it does not mean declaring these products finished. Search interest is not product usage. A tool can lose search share while keeping its paying customers, and a category can cool in search while the installed base stays put. The numbers do not prove fewer new buyers are arriving; search interest is a demand signal, not a count of buyers. The pattern is consistent with a thinner top of the funnel for a feature aimed at winning new users, and that is the read to carry into the roadmap discussion. A feature that depends on a growing pool of new buyers in this category starts with a headwind. A separate guide to verifying a trend before acting on it covers the cross-checks that separate a real cooling from a measurement quirk. The trend data topic page collects the site's other pieces on reading these signals.
Read the season before picking a launch date
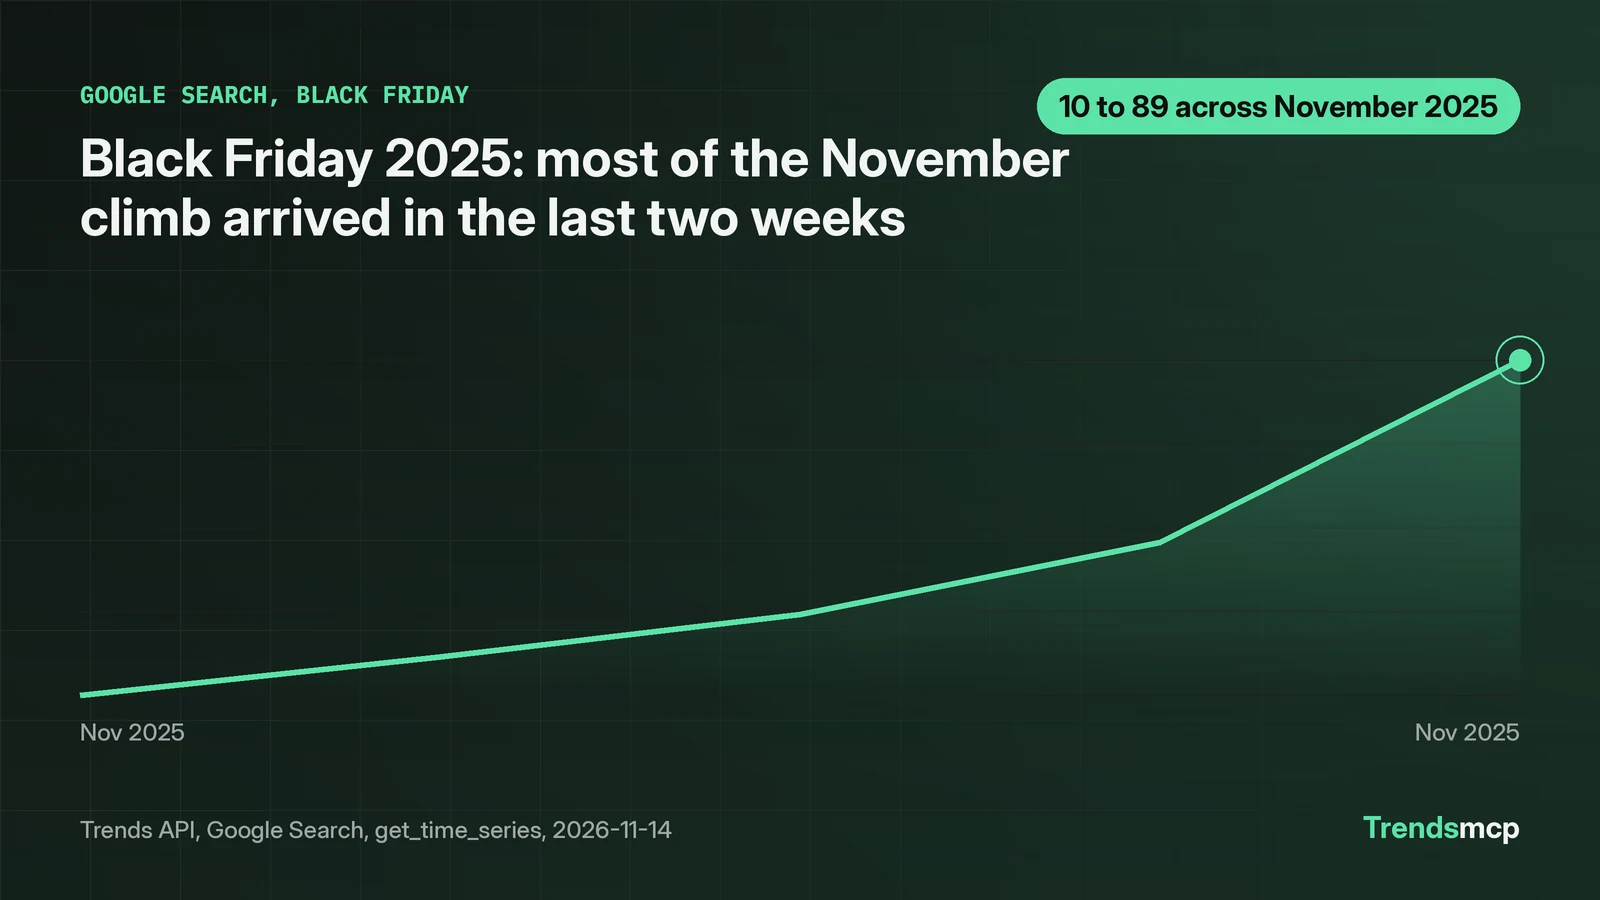
Black friday search interest rose 79 points across November 2025, and 60 of those points arrived in the last two weeks, so a launch timed to the early ramp misses most of the demand. Product managers shipping consumer features into the fourth quarter face the same shape: a seasonal peak that arrives late, and a launch judged too early looks like a failure. The seasonality check asks get_time_series for the full weekly history of one keyword, then reads the shape of the year.
Black friday on Google Search is the clearest example in the data pulled November 14, 2026: 261 weekly points from November 6, 2021 to October 31, 2026. Every November in that span peaks near the end of the month, with peaks running from 83 to 100.
| Year | November peak index | Week of peak |
|---|---|---|
| 2021 | 100 | November 27 |
| 2022 | 83 | November 26 |
| 2023 | 91 | November 25 |
| 2024 | 89 | November 30 |
| 2025 | 89 | November 29 |
The 2025 peak of 89 sits 11 points below the 2021 peak of 100. The five November peaks run from 83 to 100, a 17 point spread with no upward trend year on year. The shape inside the month is the finding that changes a launch plan. The 2025 November ramp, week by week:
| Week of | Index |
|---|---|
| November 1, 2025 | 10 |
| November 8, 2025 | 19 |
| November 15, 2025 | 29 |
| November 22, 2025 | 46 |
| November 29, 2025 | 89 |
From November 1 to November 29 the index rose 79 points, from 10 to 89. Of that rise, 60 points arrived between November 15 and November 29, over two weekly intervals. The first two weekly intervals, November 1 to November 15, delivered 19 points. A launch timed to the start of November meets an audience that has barely started searching. A launch timed to the final two weeks meets the peak.
The 2026 season had not started by the end of October. Weekly values for October 2026 were 3, 3, 4, 5 and 9 for the weeks of October 3, 10, 17, 24 and 31. The October 31 reading of 9 still sat below the 10 recorded in the first week of November 2025. Anyone judging the 2026 season on October data alone would call it dead. The five year history says the ramp comes late, and October is the wrong month to judge it. The site's Cyber Monday trends report tracks the same shopping season from a different angle.
Two calls run the whole method
Two calls return everything the method needs: get_growth for the category check, get_time_series for the seasonality check. Both run over REST with one API key.
curl -X POST https://api.trendsmcp.ai/api \
  -H "Authorization: Bearer YOUR_API_KEY" -H "Content-Type: application/json" \
  -d '{"mode": "get_growth", "keyword": "linear", "source": "google search", "percent_growth": ["3M", "12M"]}'
One get_growth call returns every window asked for, so the 3M and 12M figures above came back together. The call costs 1 request, and the history call costs 1 request as well. The free tier includes 100 requests a month; check the pricing page for current terms. That allowance covers this method many times over: four keywords for a category check plus one history pull is 5 requests.
curl -X POST https://api.trendsmcp.ai/api \
  -H "Authorization: Bearer YOUR_API_KEY" -H "Content-Type: application/json" \
  -d '{"mode": "get_time_series", "keyword": "black friday", "source": "Google Search"}'
The history call returns one point per week going back to late 2021, each with a date, a 0 to 100 index value, and a volume figure where the source has one. That is the raw material for the seasonality check: pull it once, then read the peaks and the ramp shape for the same weeks in each year. The same two calls drive a weekly trend scan, a short routine that keeps the category and seasonality checks current without a new setup each time.
A free API key works for both calls. The key comes from the account page with an email and an 8-digit code, no card required, and the same key works over MCP for assistants such as Claude and Cursor. Get the key, run the two calls, and the method is re-runnable any week; the windows roll forward, so the values change on re-run and the dated numbers above stay fixed to the week ending November 7, 2026.
What to do with each answer
The two checks produce three situations. Falling interest on both windows means shrink or delay the bet; mixed windows mean wait for the next reading; a back-loaded ramp means schedule to the peak weeks.
When the category check shows falling interest on both windows across several names, as it did for the four names above, shrink the bet or delay it. A feature aimed at winning new users in a cooling category needs a stronger reason than the roadmap slot it occupies. The stronger reason can come from usage data, sales calls, or a customer request with a name attached. Search data alone should not kill a feature that existing customers ask for by name, but it should stop a feature whose only case is that the category looks hot.
When the windows disagree, with one window up and the other down, treat the question as one of timing rather than direction. A short window falling against a long window rising can mean a seasonal dip or a news cycle passing. A short window rising against a long window falling can mean a launch spike or a press mention. In both cases the move is the same: wait for the next weekly reading and check a second source, such as news or video search, before deciding.
When the seasonality check shows a back-loaded ramp, as Black Friday does, schedule the launch and the marketing spend to the peak weeks, and judge the launch on peak week numbers, not early numbers. A launch that looks quiet in week one of a back-loaded season may be exactly on plan. The mistake is reading the early weeks as the verdict and pulling spend before the buyers arrive.
One rule covers all three situations: search interest measures demand from people looking, not usage by people already using a product. When usage data and search data disagree, usage data wins for decisions about existing customers, and search data wins for decisions about winning new ones.
What the numbers cannot say
Every growth figure above compares one week against one baseline week, so an unusual week at either end can move the result. The category check covered four names, which is enough to show a shared direction but not enough to describe a whole market. Other names in the same conversation could be rising, and the four names here were picked as known products and a concept keyword in the space, not as a complete list.
The seasonality check covers one keyword over five years. Other categories peak at other times of the year, and a keyword with no seasonal pattern will show a flat line that says nothing about launch timing. The 2026 October values show the season had not started by October 31, but they say nothing about how high the 2026 peak will reach.
None of this weakens the method. It bounds it. A product manager who runs the two checks, writes down the numbers, and re-runs them in a month has a record that beats a hunch: a dated, sourced read on whether the category is warming or cooling, and whether the calendar favors this week or a later one.