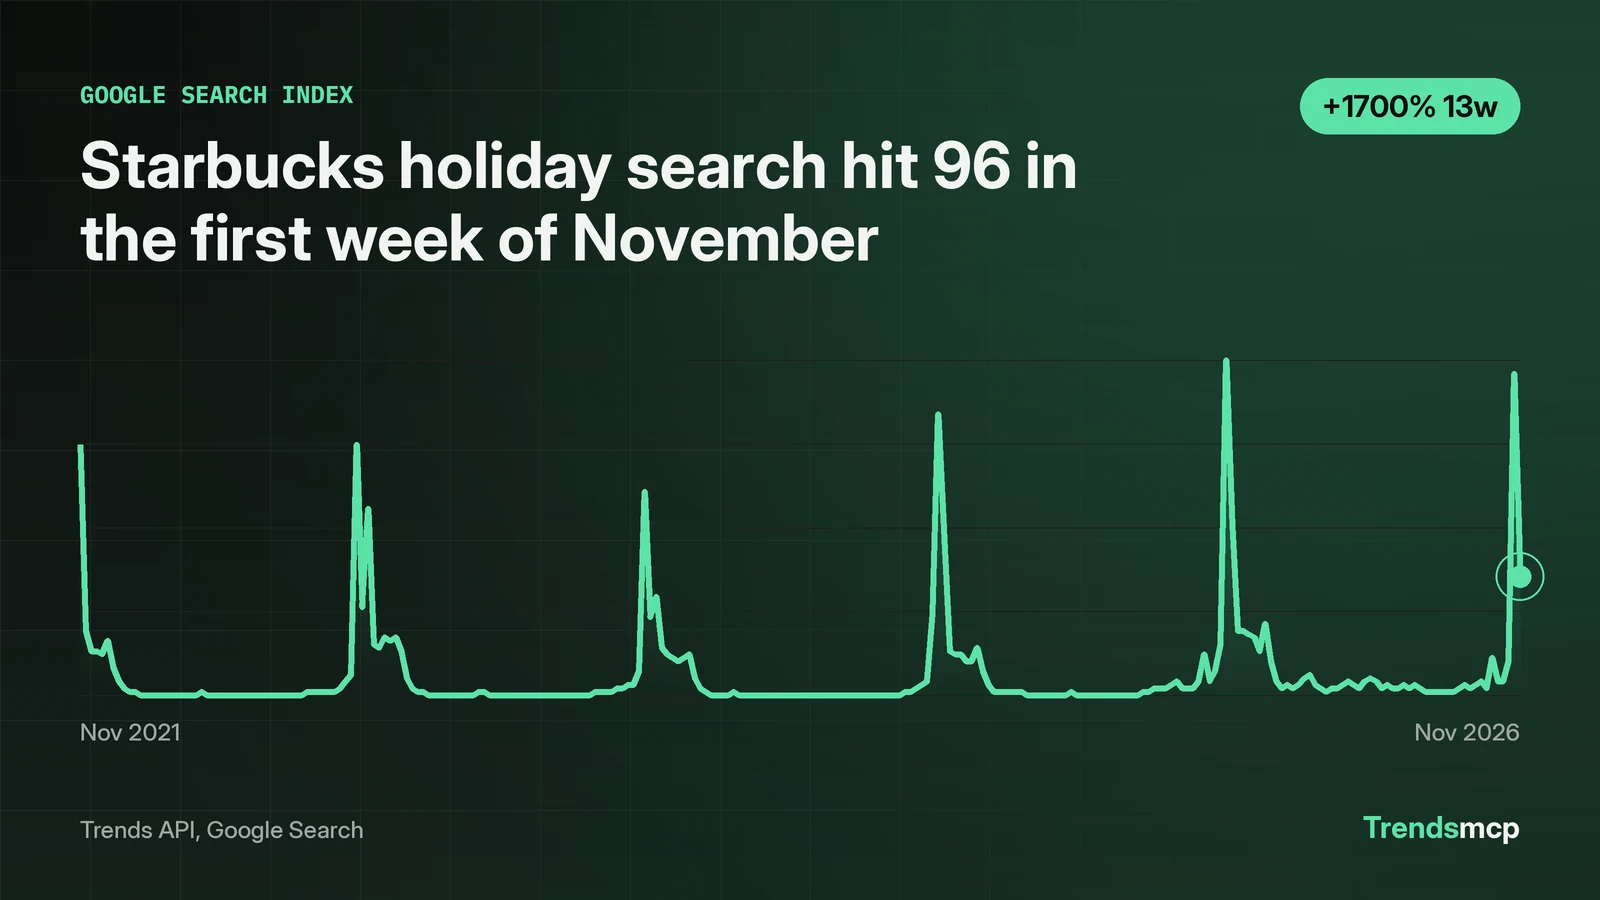
Starbucks holiday demand spiked hard in the first week of November 2026, then cooled fast. Google search for "starbucks holiday" hit 96 on the 0 to 100 index in the week dated November 7, up from 11 the week before, then fell to 36 by November 14. The drink query held better: "starbucks peppermint mocha" reached 89 in the same week and eased to 85 a week later. On TikTok, #starbucks climbed 38 spots in seven days, from 96 to 58, while #christmas sat at number 4 on the hashtag board. As of November 17, 2026, with data ending November 14, every 2026 peak so far trails its 2025 match peak to peak, though peppermint mocha runs 19.72 percent ahead on the matched week after the peak, and the broad holiday query faded within a week of the spike.
The first week of November did the heavy lifting
Search for "starbucks holiday" jumped from 11 to 96 in a single week, then gave back 60 of the 85 point gain, 70.6 percent of it, the next week.
Through September and most of October, the weekly index sat between 3 and 5, apart from 12 in the week dated October 10 and 11 in the week dated October 31. From there it jumped to 96 in the week dated November 7, then 36 in the week dated November 14. The three month growth figure, 2 on August 15 to 36 on November 14, works out to 1700 percent, but the weekly path tells the story better than the percent: a flat line, one sharp week, then a fast fade.
The shape is not new. The series holds 261 weekly points from November 2021, and shows an early November jump in each full year from 2022 on. The demand arrives in a burst each November, not as a slow build across the autumn. The jump is not always clean: in 2024 it took two weeks, 25 in the week dated November 2 then 84 a week later. The fade is not always final either: in 2022 the index fell to 27 in the week dated November 12, then rose again to 56 in the week dated November 19, and in 2023 it ticked up from 24 to 30 in the week dated November 18.
Peppermint mocha held at 85 while the broad query faded
The drink query held after the spike: 89 in the week dated November 7, then 85 a week later, a drop of 4.5 percent against the broad query's 62.5 percent fall.
"Starbucks peppermint mocha" read 17 in the week dated October 31, 89 in the week dated November 7, and 85 in the week dated November 14. Its three month growth, 4 on August 15 to 85 on November 14, is 2025 percent. Where the generic "starbucks holiday" query lost 60 points in a week, the named drink lost 4.
The split between the two queries says something about intent. A search for the holiday season in general reads as curiosity about what is new. A search for one drink by name reads as someone deciding what to order. The data cannot prove the motive, and this paragraph is inference, but the gap between the two curves is wide enough to notice: the broad query fell 62.5 percent in a week while the drink query stayed nearly flat.
TikTok rank climbed in the same window as the search spike
starbucks rose from 96 to 58 on the TikTok Trending Hashtags board in the seven days to November 17.Three holiday tags climbed sharply over the same seven days. #adventcalendar jumped 68 spots from 129 to 61, #thanksgiving rose 55 spots from 185 to 130, and #holidays rose 33 spots from 154 to 121. #christmas sat at number 4 on the board as of November 17, with #tiktokshopblackfriday at number 1 and #blackfriday at number 20.
Two limits matter here. The Trends API returned no TikTok time series for the "starbucks holiday" keyword, and the TikTok context feed for "starbucks" was unavailable, so there is no weekly TikTok curve to set beside the search curve. The TikTok evidence is rank and rank change, not volume.
The rank data cannot settle lead or lag. There is no TikTok volume series, the seven day rank window overlaps the search spike week, and there is no pre spike TikTok baseline. What the board does show is that the Starbucks hashtag was climbing on TikTok in the same window as the holiday season's arrival on the platform, with #christmas near the top of the board and the holiday tags among the fastest climbers. A reader who wants to repeat this check should read the guide to tracking TikTok trends before they peak.
The year over year gap narrows once peak timing is matched
All five growth call comparisons are negative, but the mocha gap flips once the weeks are matched like for like.
The early November peak for "starbucks holiday" by year:
| Year | Peak week | Index |
|---|---|---|
| 2021 | Nov 20, first reading | 75 |
| 2022 | November 5 | 75 |
| 2023 | November 4 | 61 |
| 2024 | November 9 | 84 |
| 2025 | November 8 | 100 |
| 2026 | November 7 | 96 |
The 2021 figure needs a note: the series starts on November 20, 2021, so that reading is the first in the data, not a verified peak. From 2022 on, the peak lands in early November, between November 4 and November 9, every year.
The twelve month comparisons use the closest matching weeks available for each term. "Starbucks holiday" compares the week after the peak in each year: 36 on November 14, 2026 against 51 on November 15, 2025, down 29.41 percent. Peppermint mocha needs two numbers, because the growth call mixes a post-peak week with a peak week: the call itself reads 85 on November 14, 2026 against 100 on November 15, 2025, down 15 percent, but on a like-for-like basis, the week after the peak in each year, mocha read 85 on November 14, 2026 against 71 on November 22, 2025, up 19.72 percent. The drink runs ahead of last year once the peak timing is matched. "Starbucks holiday drinks" compares peak week against peak week so far, 39 on November 7, 2026, the latest point in the 2026 series, against 40 on November 8, 2025, down 2.5 percent. The red cup compares 25 on November 14, 2026, the highest reading so far in a series that was still climbing, with 86 on November 15, 2025, down 70.93 percent. The Starbucks brand baseline read 78 on November 14 against 91 a year earlier, down 14.29 percent, even though it rose 47.17 percent over the three months from 53 on August 15.
The broad terms read softer than 2025, from 2.5 percent down for holiday drinks to 70.93 percent down for the red cup, while the named drink runs ahead on the matched week. One caveat keeps the comparison honest: the data ends November 14, and the 2025 peppermint mocha peak landed November 15. A further week of data could narrow the gap for the broad terms, and could still lift holiday drinks past 40 or the red cup past 25, since both of those series are incomplete.
The red cup is the quietest signal so far this year
"Starbucks red cup" came back only weakly this year, reaching 25 against 86 a year earlier.
The query read 0 on August 15 and 25 on November 14. A year earlier it read 86 on November 15. That is a 70.93 percent drop on the twelve month comparison, the steepest fall in this case study. The cup query was still climbing into November 14, from 22 in the week dated November 7 to 25, while the broad holiday query fell. The return is real but small.
The data shows the search move, not the cause. One plausible reading is that the cup itself draws less search than it used to, with attention shifting to the drinks. Another is that the cup conversation now happens under different words. Either way, a marketer planning around the red cup as the main event would be planning around the weakest of the four holiday signals measured here.
Three gaps limit what the TikTok side can claim
The TikTok side of this story rests on rank alone, with no volume series behind it. Three gaps limit what the case study can claim. First, there is no TikTok volume series for the keyword, only hashtag ranks, so the size of the TikTok conversation cannot be compared with the size of the search spike. Second, Google Ads Keyword Planner volumes were unavailable during this run, the connection failed twice, so no monthly search volume sits behind the index values. Third, the Google series is weekly, so day level timing inside the spike week is invisible, and the numbers end November 14 while the holiday season still has weeks to run.
The numbers that are here come from the Trends API calls listed in the sources: Google Search series for four Starbucks terms and growth for those four plus the brand baseline, plus the TikTok hashtag board as of November 17. Nothing in this piece comes from a press release, a news report, or an estimate made outside those calls.
How to run this check on any seasonal launch
Eleven Trends API calls produced every number in this piece: four series pulls, five growth pulls, and two TikTok board pulls.
The case study rests on three call types, and the code block below shows the three templates. Repeat the series and growth calls per keyword, with the flags as run here, to reproduce the piece for another term.
./run-with-env.sh python tools/trends.py series --keyword "starbucks holiday" --source "Google Search"
./run-with-env.sh python tools/trends.py growth --keyword "starbucks holiday" --source "Google Search" --windows 3M 12M
./run-with-env.sh python tools/trends.py top --type "TikTok Trending Hashtags" --limit 25 --sort rank_change --window 7d
The series call gives the weekly shape and the annual pattern. The growth call gives the three month and twelve month comparisons, which separate a real seasonal lift from a one week blip. The top call gives the TikTok board and the seven day rank changes, which show whether the hashtag conversation is moving with the search spike or on its own schedule.
Three habits make the check hold up. Compare the week after the peak with the same week a year earlier, not the peak with the off season, or the percent will flatter the story. Pull the same query for the named product and the broad term, since the gap between them shows intent. And record the data date, because a seasonal story goes stale in days: these numbers describe November 17, 2026, and the next weekly point could move the verdict. The docs list the available sources, and the guide to comparing Google and TikTok trends covers the cross platform workflow in full. For the earlier Starbucks season, the fall menu topic page tracks the autumn buildup that precedes the holiday spike.