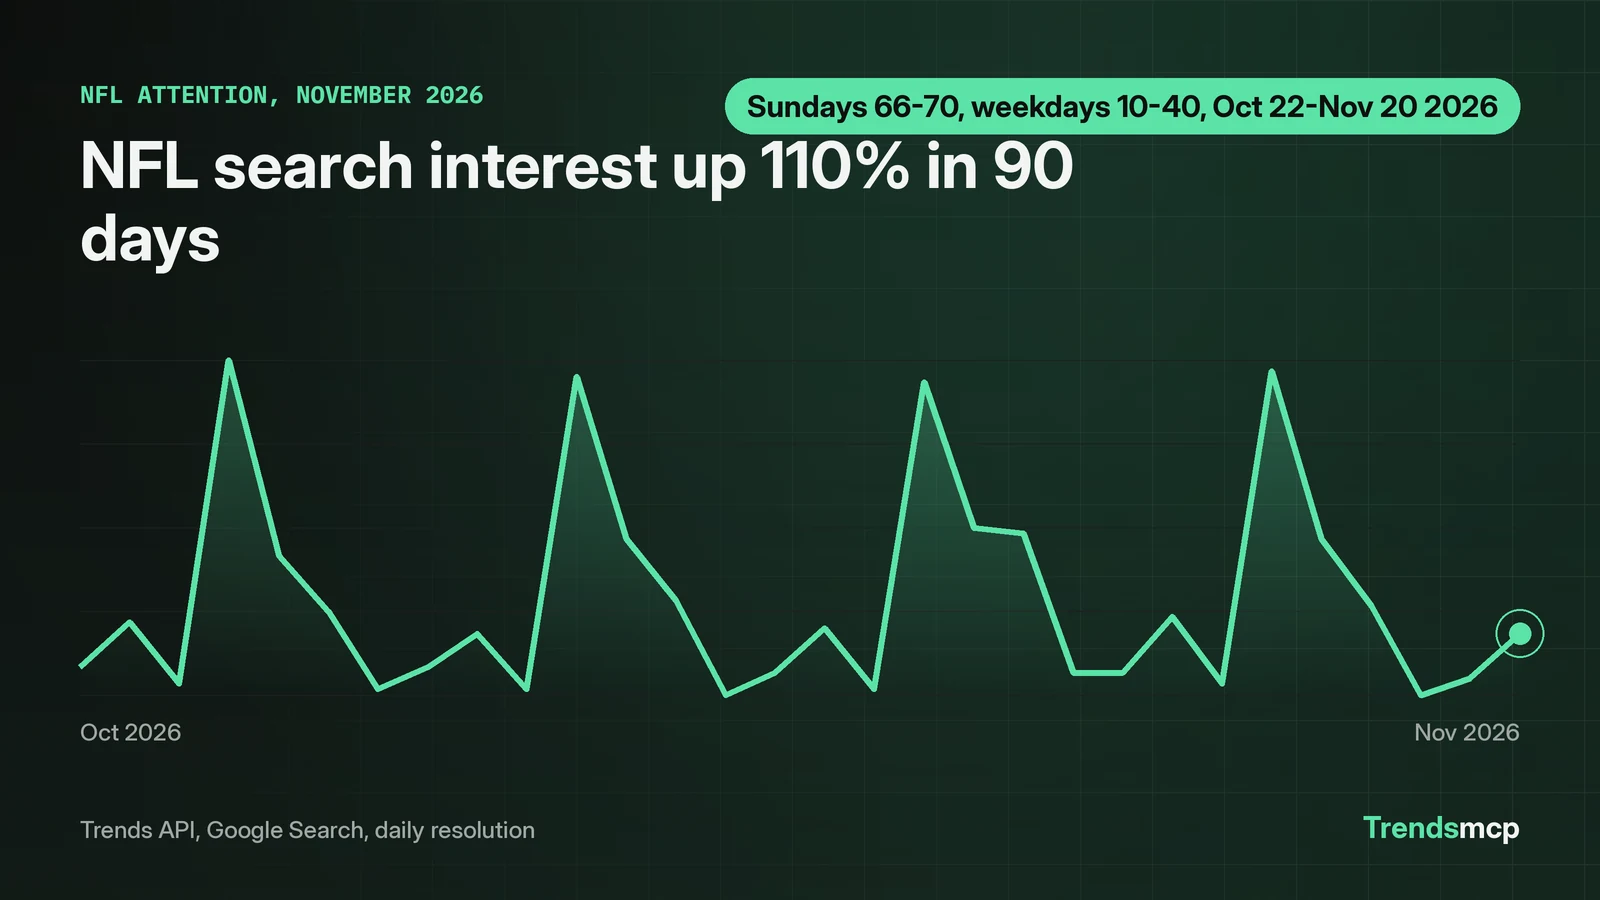
NFL attention split in two directions in mid-November. Google Search interest in "nfl" rose 110% over 90 days to an index of 42 on November 14, with a 13.5% rise in the last 7 days. YouTube interest rose 46% over the same 90 days but fell 22% in the last 30 days. Google News interest fell 84% in 7 days, from 44 to 7. TikTok volume fell 27% in 7 days. The daily search series shows the pattern: Sundays run 66 to 70 while weekdays sit between 10 and 40. X still talks football: 10 of its top 25 trends on November 17 were NFL terms. Google's November 21 board had one NFL term, and YouTube's top 25 had none.
Search interest follows the Sunday calendar
The daily Google Search series for "nfl" covers 92 days, August 21 through November 20, 2026. Its peak is 100 on September 20. Every Sunday in the last 30 days sits between 66 and 70, while weekdays in the last 30 days range from 10 to 40. The last four Sundays read 70, 67, 66 and 68, an average of 67.75 against a 20.8 average for the other days. Each Sunday runs about six times the Saturday before it: 70 against 12, 67 against 11, 66 against 11 and 68 against 12.
The pattern tracks the game calendar. Sundays carry the games. The most recent daily point, November 20, reads 21, a Friday value in line with the weekday band. Search interest in the NFL is a weekly pulse, not a steady climb.
YouTube rose over the season, then cooled
YouTube tells a slower version of the same story. Interest in "nfl" rose 46% over 90 days, from 37 on August 15 to 54 on November 14. The last 30 days point the other way: down 22%, from 69 on October 17 to 54 on November 14. The last 7 days ticked up 3.9%, from 52 to 54.
The videos drawing the views are game recaps and live shows. The top NFL video on YouTube on November 20 was the Indianapolis Colts vs Houston Texans game highlights, with 1,644,321 views, 12,001 likes and 855 comments. The next most watched was an NFL Live segment on the suspension of Rams receiver Puka Nacua, with 579,800 views. YouTube attention follows the games and the incidents around them, and the index fell from 69 on October 17 to 54 on November 14.
News coverage fell while search held
Google News moved in the opposite direction from search. Interest in "nfl" fell 84% in 7 days, from 44 on November 7 to 7 on November 14. Over 30 days it fell 89%, from 62 to 7. Over 90 days it fell 46%, from 13 to 7. The 90-day figure is smaller because news interest in mid-August was already low at 13.
The week's coverage centered on Week 11. The Ringer published "The Best Bets of NFL Week 11" on November 19, ESPN ran a Week 11 preview on November 20, and NFL.com published Week 11 power rankings on November 17. The biggest single news item in the context pull was the league suspending Rams receiver Puka Nacua for three games, reported by NFL.com on November 19. Searchers kept looking the league up while the news cycle moved past its mid-October peak. That split is the finding: search demand and news supply are not the same signal, and they diverged in November.
TikTok volume slid as the index went dark
TikTok is the weakest leg of this comparison, and the numbers show why. Estimated TikTok volume for "nfl" fell 27% in 7 days, from 225,647,545 to 165,753,284, and 39% in 30 days, from 270,015,131. The index reading behind those volumes is unusable: it read 0.0 on November 18 after 31.8 on November 11 and 55.4 on October 20. A zero index next to 166 million in estimated volume is a data fault, not a finding, so this piece cites the volume change and not the index.
TikTok's series also covers less ground than the others. It runs from October 20 to November 18 only, so the 90-day window returns a date-out-of-range error and no figure. Anyone comparing TikTok with Google Search on a 90-day window is comparing a full series with a one-month slice. The honest read is narrower: TikTok volume for "nfl" fell by about a quarter in the week to November 18.
X talks football; Google and YouTube moved on
The live boards disagree about how much the NFL matters right now. On X, 10 of the top 25 trends in the November 17 snapshot were NFL terms: Ravens at No. 1, Chargers at No. 3, Jacoby Brissett at No. 6, Justin Herbert at No. 8, Derrick Henry at No. 9, Mark Andrews at No. 13, Zay Flowers at No. 15, #LACvsBAL at No. 16, #BoltUp at No. 17 and Monday Night Football at No. 24. That snapshot is four days old, from November 17 at 03:01 UTC, and it captures the Monday night game conversation.
Google's board on November 21 tells a different story. Only one of its top 25 terms was NFL related: "vikings vs packers" at No. 20. The top of the board belonged to GTA 6 reviews, Anthropic stock and Robert Pattinson. YouTube's November 21 top 25 had no NFL items at all; its top three were a music video, an Avengers teaser and a GTA 6 video. X is where the football conversation concentrates. Search and video moved on to the week's bigger releases.
What this data cannot show
Three gaps shape this piece. Reddit growth is disabled in the Trends API, returning a source-disabled error, and X offers no growth endpoint, so neither platform has a growth figure here. Live post context for X and Reddit returned "source unavailable" for "nfl" on November 21. The Reddit Hot Posts board snapshot is dated October 27, 25 days old, so no claim in this piece rests on it.
Dates matter too. The growth figures use weekly points ending November 14. The daily search series ends November 20. A reader checking these numbers on a later date will see different values, and the Sunday pattern is the part most likely to repeat: four straight Sundays at 66 to 70 is a calendar effect, while a single week's news spike is not.
Pull the same numbers with one call each
Every figure above came from the Trends API on November 21, 2026. The growth call for one source is:
python tools/trends.py growth --keyword "nfl" --source "Google Search" --windows 7D 30D 90D
Swap the source for "YouTube", "Google News" or "TikTok" to get the other legs. The daily series behind the chart is:
python tools/trends.py series --keyword "nfl" --source "Google Search" --resolution daily
The boards are one call each:
python tools/trends.py top --type "X (Twitter) Trending" --limit 25
python tools/trends.py top --type "Google Trends" --limit 25
python tools/trends.py top --type "YouTube Trending" --limit 25
With the Trends MCP server connected in Claude, one prompt covers the growth table: "Compare Google Search, YouTube and Google News growth for 'nfl' over 7, 30 and 90 days." Setup lives on the MCP server for Claude page. The best tools to compare Google and TikTok trends page covers the cross-platform comparison in more depth, and how to track TikTok trends before they peak covers the TikTok data quirks. The Google Trends API in Python guide shows how to pull the same series into code.
Two checks before trusting any cross-platform comparison: confirm each series ends on the same date, and check the snapshot date on every board. The NFL numbers pass the first check only in part. Google, YouTube and Google News growth all end November 14, but TikTok ends November 18 on a 30-day series, and the X board lags four days behind the Google board. Those lags are part of the answer, not a footnote to it.