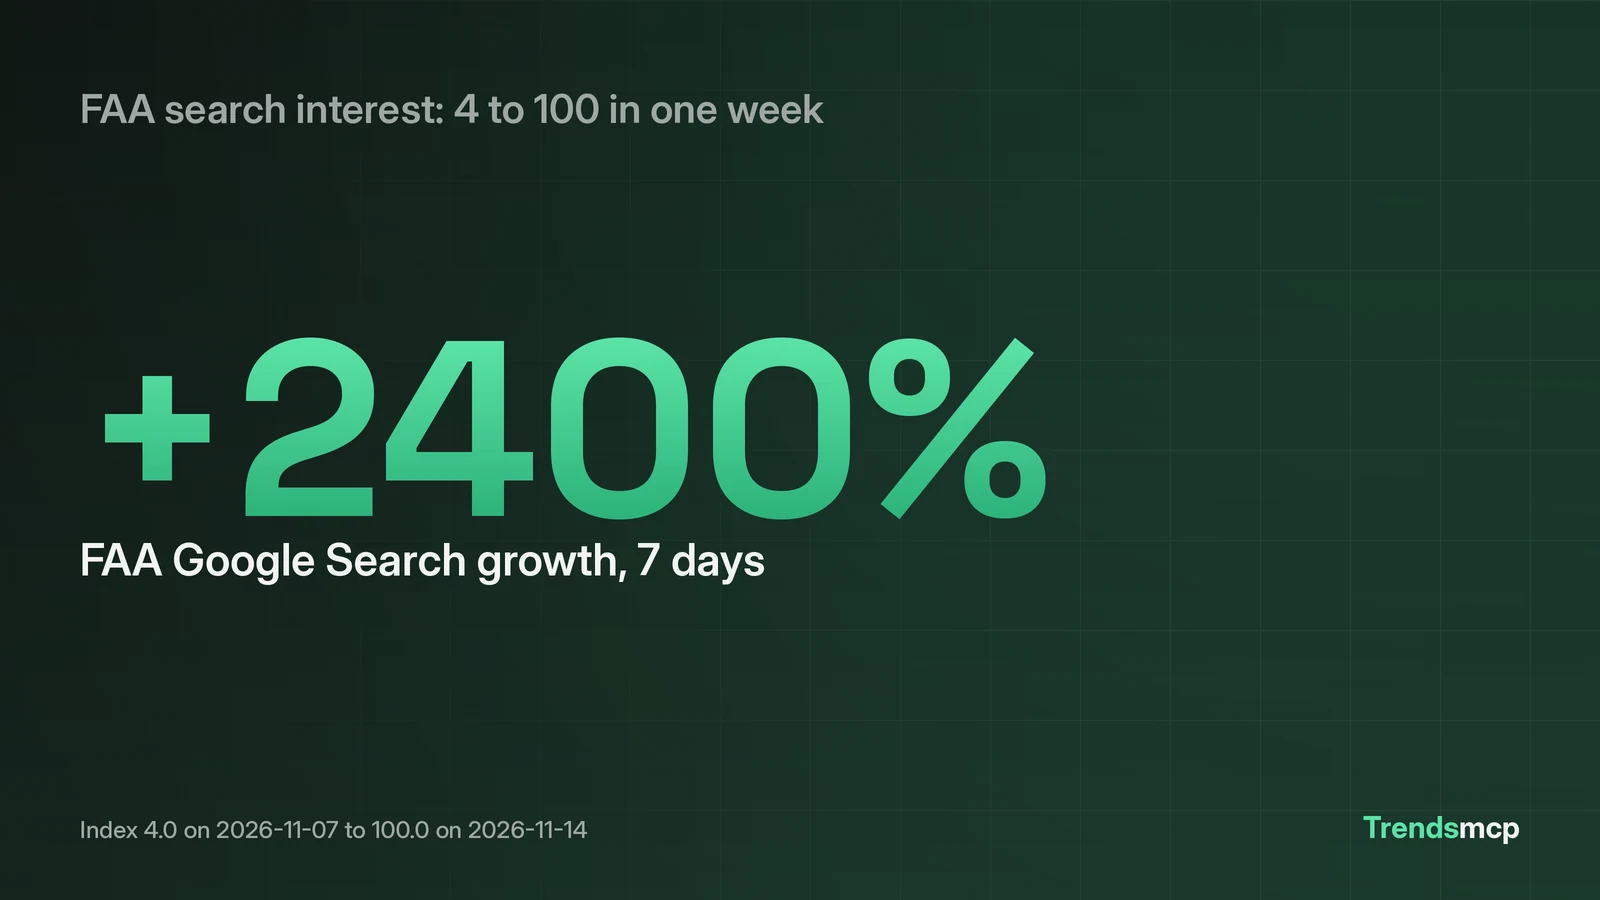
Connect Claude to the Trends MCP server, ask it what is trending, and the answer comes back with numbers dated today, not from training data. On Claude.ai and Claude Desktop, no API key is needed: point a custom connector at https://www.trendsmcp.ai/mcp, sign in, and six tools that read live boards, history, growth, and news context become available in chat. The worked example below runs those calls on November 18, 2026. FAA search interest sat at 4 on a 0 to 100 index for five straight weeks, then hit 100 in the week ending November 14, a rise of 2,400 percent in seven days, tied to a nationwide ground stop that was lifted on November 13.
Connect Claude with no key to paste
The fastest path runs through Claude's own connector settings. In Settings, open Connectors, choose to add a custom connector, and give it the name Trends MCP with the address https://www.trendsmcp.ai/mcp. Claude then asks for a Trends MCP sign-in; once that is done, the connector shows in the list and its tools work in any chat where it is switched on.
Clients that ask for a key instead of a sign-in use a free key, which covers the same ground. One is created on the account page from an email address plus an 8-digit code, with no card asked for. The free plan includes 100 requests a month. Key-based clients use the other address, https://api.trendsmcp.ai/mcp, sending the key as an Authorization: Bearer header. Claude Code, Cursor, and VS Code each accept that address and header in their own config file. The exact config for each client sits on the MCP server for Claude page.
One detail matters for freshness. Free accounts see boards a day behind unless they hold purchased credits. The pricing page says boards are real-time on Starter, Pro and Business. The boards in this post carry a snapshot timestamp of 09:01 UTC on November 18, 2026, so a reader on a paid plan or holding credits sees the same rows. A reader on the free plan without credits sees this snapshot a day later, after the board has already moved on. That lag changes nothing about the setup steps.
Six tools cover the whole job, and three answer most questions
Claude gets six tools from this one connector. Each one answers a different question, and each one costs requests in a different way.
| Tool | Question it answers | Cost per call |
|---|---|---|
get_top_trends | What is moving right now, with no keyword needed | MCP: 1 request per 10 rows, at most 10 per call. REST: 1 request per call |
get_time_series | How has one topic moved over about five years | 1 request |
get_growth | How fast is one topic rising, over one or more windows | 1 request, every window included |
get_context | What are people posting, reading, and betting about a keyword | MCP: 1 request per source, at most 5 per call. REST: 1 request per source |
get_top_posts | Top posts for one hashtag, fetched live | 1 request, Business plan |
get_usage | Plan, requests used and left, reset date | Free, MCP only |
Three of these do most of the daily work. get_top_trends opens the day: it returns a ranked board with no keyword, so it shows what strangers are already searching for. get_growth tests whether a spike is real: it compares two dates and returns a percent, a direction, and both index values. get_context supplies the reason behind the move: news stories, videos, and posts about the keyword, with dates and engagement. get_time_series fills in the longer view when a single growth number needs a shape behind it.
Ask Claude in plain words and it picks the tool. "What is trending on Google today" calls get_top_trends on the Google Trends board. "How fast is FAA search rising" calls get_growth with the keyword faa on Google Search. "Why is FAA trending" calls get_context with the News source. The prompt stays in plain language; the tool call and its parameters stay visible in the chat, so the reader can check what ran. The Google Trends in Claude guide walks through the same board calls with a search focus.
A worked example: FAA search interest went from 4 to 100 in one week
FAA topped the Google Trends board on November 18, 2026, ahead of "outlook outage" at number 2, "robert pattinson" at number 3, "microsoft outage" at number 4, and "flights grounded" at number 9. That board alone says what people searched for. It does not say how fast the move was, or why it happened. Two more calls answer both.
get_growth on faa, source Google Search, windows 7D, 30D, and 12M, returned the same story at three scales. Over 7 days, the index rose from 4.0 on November 7 to 100.0 on November 14, growth of 2,400 percent. Over 30 days, the same two values: 4.0 on October 17 to 100.0 on November 14, also 2,400 percent. Over 12 months, the index rose from 12.0 on November 15, 2025 to 100.0 on November 14, 2026, growth of 733.33 percent. All three windows succeeded, and the tool reported 261 data points behind the calculation.
get_time_series on the same keyword and source returned 261 weekly points from November 20, 2021 to November 14, 2026. The tail of the series shows why the growth number is so large: the value sat at 4.0 for five straight weeks, October 10, October 17, October 24, October 31, and November 7, then jumped to 100.0 on November 14. A flat baseline makes the percent look extreme. The absolute move, from 4 to 100 on a 0 to 100 index, is the number to quote. The percent is the echo.
get_context on faa with the News source, looking back 7 days, returned 10 items. The top story, published November 13 at 23:17 UTC, read "FAA has lifted its third-ever nationwide ground stop." A second item from The Washington Post read "FAA lifts ground stop at U.S. airports, leaving travel chaos." A third item carried the Transportation Secretary's announcement of the lifting on November 14. The spike has a named cause with a date, and the dates line up: the ground stop story broke November 13, and the search index hit 100 in the week ending November 14.
The same three calls each take a keyword, so any row on the board works the same way. Pick a row, run growth, run context, and the result is a spike with a size and a cause instead of a bare rank.
Read a board the way an analyst reads it
Three boards ran on November 18, 2026, all stamped 09:01 UTC. The Google Trends board, top 10, read: faa, outlook outage, robert pattinson, microsoft outage, "what time does gta 6 come out", dan hicks, blackout, chase bank, flights grounded, kimberly powell. The YouTube Trending board opened with "Lil Baby - Aint Goin (Official Music Video)", then a Twilight teaser trailer, then a gaming video titled "TREES HATE YOU... (Full Game Part 1)". The TikTok Trending Hashtags board opened with tiktokshopblackfriday, meme, nfl, christmas, and musteatinmycity.
A board rewards three habits. First, read across boards, not down one. FAA led Google while TikTok led with shopping and the NFL, so the search spike was a news event, not a platform-wide mood. Second, check the timestamp. Every board in this post carries as_of_ts 2026-11-18T09:01:41Z. A board without a timestamp is a rumor. Third, treat a rank as a starting point. Rank 1 on Google Trends means the most searched term on that board at that snapshot. It says nothing about how fast it rose or how long it lasts. Growth and context supply those two facts.
One call in this run returned nothing, and the nothing is worth noting. get_top_trends on Google Trends with sort rank_change and window 7d returned 0 rows, with the note "No baseline snapshot within 3 days of 2026-11-11 for 'Google Trends'." The climbers view needs a baseline snapshot, and none existed close enough to November 11. The tool note suggests retrying with window 30d. A tool that says it has no baseline is working as designed. A tool that invents one would be worse.
When the numbers lie to you: zero baselines
A second growth call in this run shows the trap to watch for. get_growth on "outlook outage", source Google Search, windows 7D and 30D, returned a growth figure of 999999 for both windows, with a baseline value of 0.0 and a recent value of 100.0. The response also carried a warning: the underlying signal is over 90 percent zero values, and the trend should be treated with caution. The data quality flag read "low".
That 999999 is a sentinel, not a measurement. Dividing by a baseline of zero has no answer, so the tool returns a placeholder. The honest reading is simpler: "outlook outage" had almost no search interest before, then hit the top of the index. Quote the move from 0 to 100, quote the rank of 2 on the board, and leave the percent out. Any percent built on a zero baseline misleads the reader.
Two checks catch most bad numbers before they reach a reader. First, look at the baseline value in the growth result. A baseline of 0, or a baseline under 5 on a 0 to 100 index, makes the percent fragile. Second, look at the series. FAA sat at 4.0 for five weeks before jumping, so the 2,400 percent rested on a real flat line. A term that flickers between 0 and 3 has no line to stand on. The tool returns the raw values with every growth call, so both checks take seconds.
What a request costs on each plan
The worked example above cost 1 request for each board call on REST, 1 request for the growth call covering three windows, 1 request for the time series, and 1 request for the context call. Six calls, six requests, on the REST counting for the core example. Two diagnostic calls ran alongside it, the rank-change view and the outlook outage growth check, so the full run was eight calls and eight requests. On MCP, the same board calls cost 1 request per 10 rows, so a 10-row board costs 1 request and a 100-row board costs 10.
The pricing page, read on November 18, 2026, lists three standard paid tiers plus free, and an Enterprise tier on custom pricing (contact sales) for custom volume, redistribution, private sources, SLA and SSO. Free costs $0 a month and includes 100 requests a month, full history, all top trends, and 54 data sources, with boards a day behind for free accounts. One figure differs between sources: the API reference lists 53 data sets, while the live pricing page lists 54 data sources, and this post uses the live figure. Starter costs $16 a month billed annually ($192 a year), includes 1,000 requests a month and 10 keyword alerts. Pro costs $39 a month billed annually ($468 a year), includes 5,000 requests a month and 50 keyword alerts. Business costs $159 a month billed annually, includes 25,000 requests a month and 250 keyword alerts. Credit packs sit outside the plans: 600 credits for $15 once, and 1 credit equals 1 request. Failed calls are free, and credits never expire. The pricing page carries the current figures.
For a reader who only checks a board most mornings, the free 100 requests cover about three 10-row board calls a day. Readers weighing this server against other options can compare it with the best MCP server for live trend data. get_usage reports the count, so the reader can check the balance inside Claude instead of guessing.
Three prompts to run after setup
These three prompts test whether it works, using the same calls as the worked example.
- "What is trending on Google today, top 10?" This should return the live board with a timestamp from today. Compare the top row with the board in this post. FAA led on November 18. A different leader on a later day proves the data is live.
- "How fast is [top term] rising on Google Search over 7 days and 30 days?" Replace the bracketed text with the board leader. The answer should show both index values and both dates, not just a percent.
- "Why is [top term] trending? Show me the news from the last 7 days." The answer should name dated stories, as the FAA example named the November 13 ground stop stories. A spike with no dated cause is a prompt to dig further, not a finding.
When all three return dated, sourced answers, Claude is reading live trend data. When any of them returns a stale timestamp, a zero baseline, or an empty board, the checks in the two sections above say what to do next.
FAQ
Does Claude need an API key to read live trend data?
No. On Claude.ai and Claude Desktop, sign in through the connector at https://www.trendsmcp.ai/mcp and no key is pasted anywhere. Clients such as Claude Code, Cursor, and VS Code use the key URL, https://api.trendsmcp.ai/mcp, with the key in an Authorization: Bearer header.
How fresh is the data Claude sees?
Boards carry a snapshot timestamp. The boards in this post were stamped 09:01 UTC on November 18, 2026. Paid tiers get boards live, per the pricing page, and free accounts without credits get the board a day late. Time series points run weekly, with the latest point dated November 14, 2026 in this run.
Why did the climbers view return no rows?
The rank change sort needs a baseline snapshot near the window start. On November 18, no baseline existed within 3 days of November 11 for the Google Trends board, so the 7-day climbers view returned 0 rows. The tool note suggests retrying with a 30-day window.
What does a growth of 999999 mean?
It means the baseline value was zero, so no percent can be computed. The tool returns 999999 as a placeholder and flags data quality as low. Quote the move in index points, from 0 to 100, and leave the percent out.