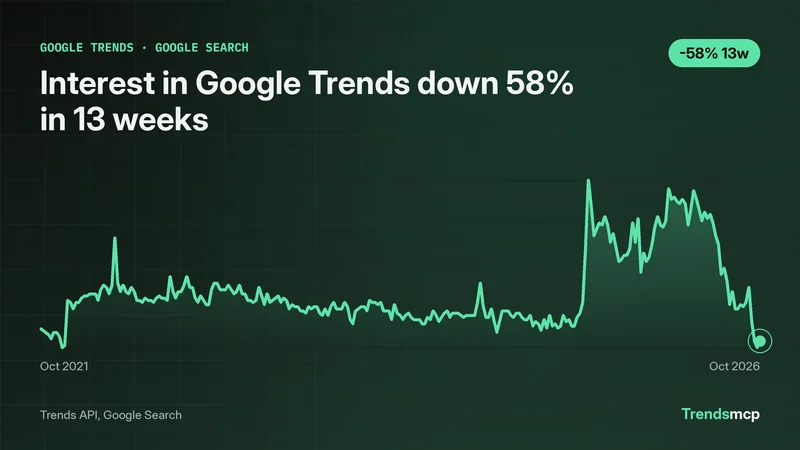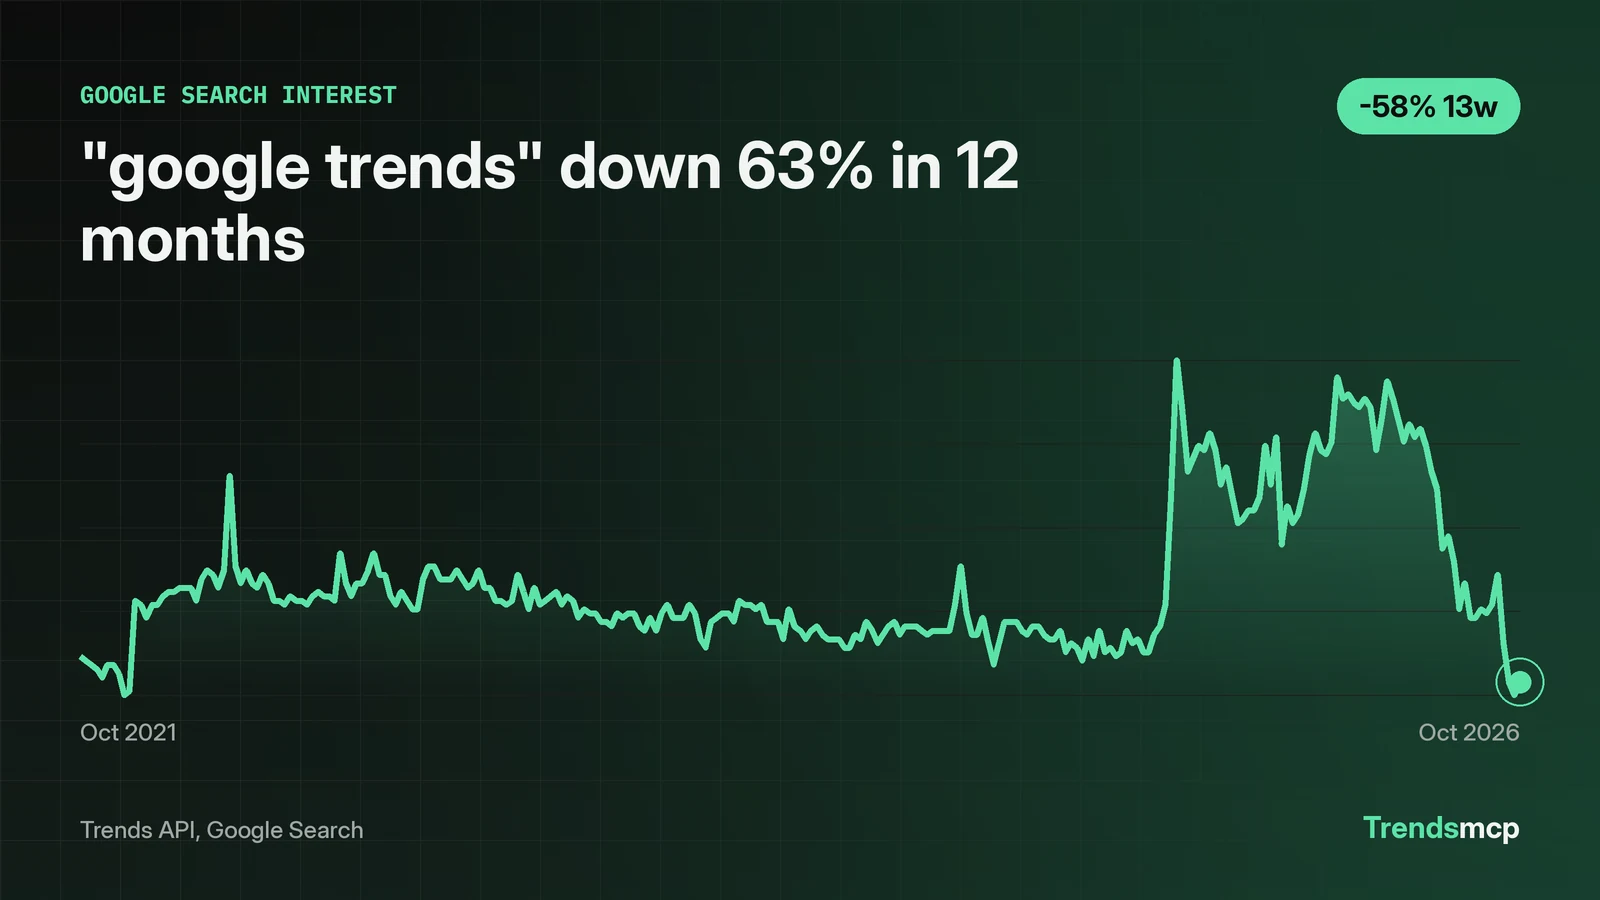
Google Trends data is a relative index, not a count of searches. Every point sits on a 0-100 scale, and the top of the scale belongs to the strongest week in the window; every other week is a share of that peak. The worked example in this primer is the keyword "google trends" itself: 261 weekly Google Search points from October 30 2021 to October 24 2026, opening at 31.0 and closing at 25.0. The latest point, 25.0 for the week of October 24 2026, sits 63.24% below the 68.0 reading of October 25 2025 and 57.63% below the 59.0 reading of July 25 2026. Those percents come from the growth call, not from eyeballing the curve. Data pulled November 5 2026.
100 is the keyword's own peak, not a headcount
On this five-year series, 100 labels the week of August 16 2025, the highest week for "google trends" in the window, and every other reading is a fraction of that peak week. The latest reading of 25.0 means the week of October 24 2026 drew about a quarter of the search volume of that peak week. It does not mean 25 searches, 25 thousand searches, or 25% of all Google searches. There are no absolute counts anywhere in this data.
That distinction changes how the 12-month fall reads. A drop from 68.0 to 25.0 is a fall in interest for one phrase relative to its own past, not a claim about search as a whole. The phrase could still draw a large absolute volume while its index falls, if the peak week was simply much larger. The index never answers "how many." It answers "how much, compared with this keyword's own best week."
The series here starts at 31.0 on October 30 2021, which is 31% of the August 2025 peak. On a shorter window with a lower peak, that same week would print higher. A chart image with its axis dates cropped away keeps its outline but loses the scale that gives the numbers meaning, so a reader cannot tell which week the 100 belongs to.
Quote the window and both endpoints, or the percent means nothing
The 12-month fall of 63.24% is a point-to-point comparison of 68.0 on October 25 2025 against 25.0 on October 24 2026, and it means nothing without those endpoints attached. The growth call divides the reading at the end of the window by the reading at the start and reports the change. The weeks in between never enter the calculation, so a stray high or low print on either boundary week moves the result even when the middle of the series was steady. That is why the two readings belong beside the percent whenever it is quoted.
The three-month window tells a sharper story than the 12-month one. From July 25 2026 to October 24 2026 the series fell from 59.0 to 25.0, a 57.63% drop. Set that beside the 12-month figure and the shape of the decline comes into focus: the series rose from 68.0 to a 96.0 print in the week of March 7 2026, after dipping to 57 in the week of December 27 2025, then fell to 59.0 by July 25 2026, and gave up 34 of the 43 points of the 12-month fall in the last three months. Two windows, same series, different stories, and both are true at once. That is why a percent without its window is not a finding. It is a fragment.
The habit to build is mechanical. State the span first, then the two dated readings, then the percent. "Down 63.24% in 12 months (68.0 on October 25 2025 to 25.0 on October 24 2026)" can be verified against the data. "Interest is collapsing" cannot. The second sentence sounds stronger and says less.
Weekly points answer weekly questions only
Each point in this series covers one full week, so the latest point describes the week of October 24 2026, not November 5. A one-day burst inside a week lifts that whole week's number, and the timing inside the week stays invisible. A slow slide across a month shows up as a staircase of weekly steps. The resolution sets the questions the data can answer, and weekly data cannot answer daily ones.
Daily resolution exists for shorter recent windows, which is the right tool when the question is about a single event or a launch week. The Trends API reference (reference/TRENDS_API.md) lists 'daily' (last 90 days, fetched live) alongside 'weekly' (about 5 years, the default) for Google Search, and offers no hourly option. The choice is a trade: daily points for recency, weekly points for the five-year view. Mixing the two in one sentence, quoting a daily spike against a weekly baseline, is the same error as comparing two separately normalized series. Keep the resolution in the sentence with the number.
Freshness has the same trap. The latest weekly point always lags the calendar by days, because a week has to finish before it can be counted. Treat the most recent point as the most recent completed week, never as today. The trend graph guide shows the same discipline applied to reading a chart: level, slope, shape, each checked against the dates on the axis.
Two keywords need one shared scale, not two index lines
A 25 for "google trends" and a 25 for another keyword are not the same amount of search, because each series normalizes to its own peak. Overlaying two separately pulled 0-100 series and reading the gap between the lines as a real gap is the most common error in trend analysis. The lines share a shape on the page and nothing else.
The fix is to compare like with like. Run a separate growth call for each keyword over the same window and compare the percents, since get_time_series and get_growth each take one keyword per call and no documented call pulls two keywords together. Growth rates are comparable even when index levels are not: a 57.63% three-month fall for "google trends" against a 92.86% fall for "google trends api" over the same dates is a real comparison, because both percents are computed the same way over the same window. Index levels never are.
This is also where the growth call earns its keep against the chart. A reader scanning the chart tends to judge the fall by how rough the line looks rather than by where it starts and ends, so a bumpy slide can seem worse than the endpoint numbers justify. The three-month fall from 59.0 to 25.0 looks dramatic on the curve and is dramatic in the numbers too, but the only way to know that is to compute it. Quote the call, not the impression.
The API keyword fell much harder than the headline keyword
"google trends api" turns the comparison rule into a worked example. Its series also runs 261 weekly points from October 30 2021 to October 24 2026, opening at 0.0 and closing at 2.0, and it also peaked at 100 in the week of August 16 2025. But the growth rates diverge sharply: the API keyword fell 92.86% in three months (28.0 on July 25 2026 to 2.0 on October 24 2026) and 94.74% in 12 months (38.0 on October 25 2025 to 2.0), against 57.63% and 63.24% for "google trends" over the same windows. The shared peak week is an artifact of normalization, not a tie in volume: each series sets its own 100, so matching peaks say nothing about how many searches each phrase drew. The growth rates are the honest comparison, and they show the API keyword falling far harder than the headline keyword.
The two calls behind this primer
In Claude with Trends MCP, put "using TrendsMCP" in the request so the model picks up the tools rather than searching the web:
get_time_series(keyword="google trends", source="google search")
get_growth(keyword="google trends", source="google search", percent_growth=["3M", "12M"])
Over REST, a single key covers both calls:
POST https://api.trendsmcp.ai/api
{"mode": "get_time_series", "keyword": "google trends", "source": "google search"}
The time series endpoint hands back the weekly readings that make up the curve. The growth endpoint turns two of those readings into a percent change, so the slope is calculated instead of guessed from the shape of the line. The Google Search trends topic carries the demand story for this source. For what to do with the numbers once they are pulled, the AI analysis piece shows a different angle: analyze Google Trends data with AI hands the same kind of series to a model and asks it to find the story, while this primer stays on what the numbers are. The search figures underneath come from Google; see Google Trends. Pull the series, quote the window, and check the endpoints before quoting the percent.