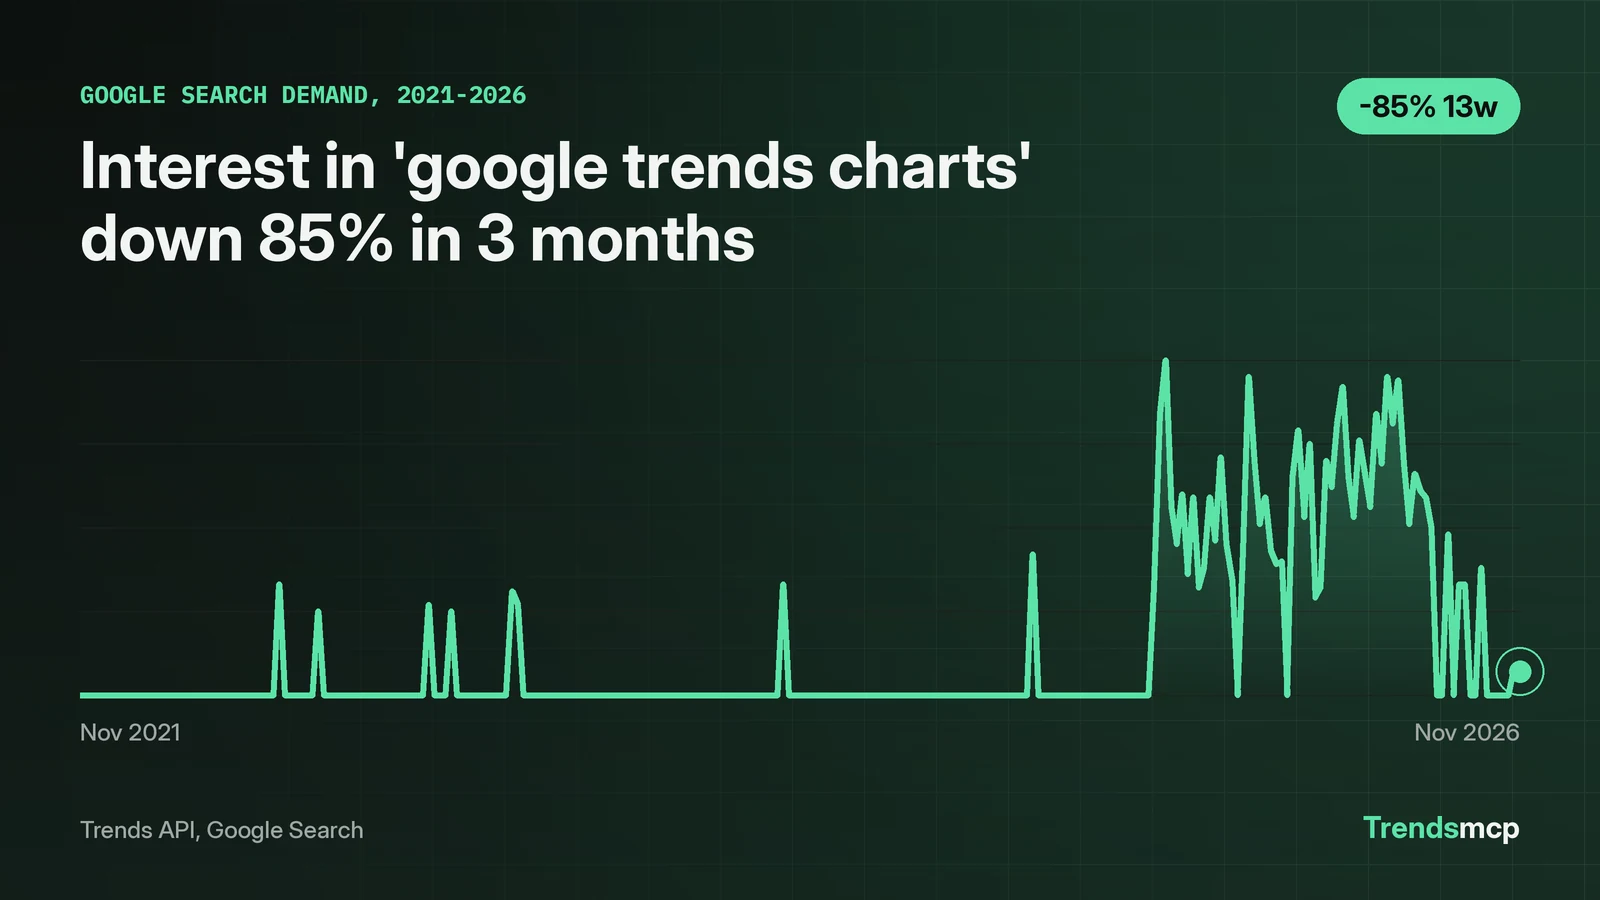
A Google Trends chart has one rule that trips up most readers: the vertical axis is not a count of searches. It is a 0 to 100 index, and 100 marks the highest point in the selected period. Read with that in mind, the charts answer three questions well: when interest moved, how two terms compare, and where the interest sits. This guide works through a real example, the search phrase "google trends charts" itself, which draws 480 monthly searches. The phrase averaged 2.1 or less in each year from 2022 through 2024, peaked at 100 in mid-August 2025, and fell to 7 by November 7, 2026, down 85% in three months. Every number below was pulled live from the Trends API on November 8, 2026; the last section shows the calls that fetch the chart again.
Start with interest over time, and read the scale first
The peak defines the scale: this series averaged 2.1 or less in each year from 2022 through 2024, then jumped to 100 in mid-August 2025. The interest-over-time chart is the default view, and the first thing to check is what that peak means. In this example, the series covers 261 weekly points from November 13, 2021 to November 7, 2026. The lowest reading is 0, and 198 of the 261 weeks read 0, including the first three weeks of the series. The yearly averages show the shape at a glance: 1.1 in 2022, 2.1 in 2023, 0.6 in 2024, 23.1 in 2025, and 44.0 in 2026, where the 2026 figure covers 45 weeks to November 7. The low averages hide isolated spikes: 33 in the weeks of July 23, 2022 and April 20, 2024, and 42 on March 1, 2025, before the August 2025 jump.
The fall is just as clear. August 2026 averaged 22.8, and the October to early November 2026 average was 2.5. Point-to-point growth makes the fall concrete: the index read 48 on August 8, 2026 and 7 on November 7, a drop of 85.42% in three months. The twelve-month figure is nearly as steep: 34 on November 8, 2025 to 7, a drop of 79.41%. Only 35 of the 261 weeks reached 50 or higher, and 9 reached 80 or higher. Only 2 of those 9 fall in August 2025; the rest spread from November 2025 to June 2026, with the latest on June 6, 2026.
Two habits keep the reading honest. First, remember the index resets to the peak of whatever period is on screen, so the same week can read 100 in a five-year view and a lower number in a one-year view. Second, a low reading near zero does not mean zero searches. It means the volume was too small to register against the peak, which is exactly the case here for 2022 through 2024.
Compare two terms before trusting one line
The comparison term peaked later and fell almost identically. One line on its own invites overreading, so adding a second term shows whether a move belongs to the topic or to the whole category. The phrase "search trends" makes a useful comparison: it peaked at 100 later, in early May 2026, and its latest reading is 9 on October 31, 2026, down 79.07% over three months and 79.55% over twelve.
| Measure | "google trends charts" | "search trends" |
|---|---|---|
| Peak value and date | 100, Aug 16, 2025 | 100, May 9, 2026 |
| 3-month growth | -85.42% (48 on Aug 8, 2026 to 7 on Nov 7) | -79.07% (43 on Aug 1, 2026 to 9 on Oct 31) |
| 12-month growth | -79.41% (34 on Nov 8, 2025 to 7 on Nov 7, 2026) | -79.55% (44 on Nov 1, 2025 to 9 on Oct 31, 2026) |
| Latest value | 7, Nov 7, 2026 | 9, Oct 31, 2026 |
The two phrases dropped together through the second half of 2026, with the charts phrase falling slightly faster over three months. The shared direction suggests a category-wide cooling rather than something specific to one phrase, though the data on its own cannot name the cause. The same caution from the last section applies here: each line is scaled on its own 0 to 100 axis, so the table compares direction and timing, not absolute search volume. The Google Trends landing page keeps this kind of comparison live across the product's data.
Related queries show what readers actually want
The related queries all ask for the same thing: a picture of popularity. The related-queries chart answers a different question from the line chart: not when interest moved, but what people typed around the topic. Keyword Planner gives the same signal in numbers for this phrase. "Google search popularity chart" draws 90 monthly searches, "google popularity graph" and "google popularity chart" draw 70 each, "google search trends graph" draws 20, and "google trends top charts", "trend chart google", and "trend graph google" draw 10 each, all with LOW competition.
This suggests readers want a picture of popularity, and they phrase it seven different ways. Someone building for this audience should lead with the chart itself and keep the explanation of the scale next to it, because the scale is the part readers get wrong. A chart without its scale note invites the exact misreading this guide opens with.
Build the same chart with one API call
Google Trends in the browser gives the picture; the Trends API gives the numbers behind it, so the chart can be rebuilt, compared, or dropped into a report. The call below pulls the full five-year weekly history used above:
{
  "tool": "get_time_series",
  "keyword": "google trends charts",
  "source": "Google Search"
}
The growth call returns the 3-month and 12-month change in one request, for one term or several:
{
  "tool": "get_growth",
  "keyword": "google trends charts, search trends",
  "source": "Google Search",
  "percent_growth": ["3M", "12M"]
}
Over plain HTTP, each call is a single POST:
curl -X POST https://api.trendsmcp.ai/api \
  -H "Authorization: Bearer YOUR_KEY" \
  -H "Content-Type: application/json" \
  -d '{"mode": "get_time_series", "keyword": "google trends charts", "source": "Google Search"}'
The growth math is simple: latest weekly value minus the value one window earlier, divided by that earlier value. One strong week at either end swings the result. Python readers can copy the calls from the Google Trends API Python guide. Readers who prefer a no-code route will find free chart tools in the best Google Trends alternatives. For a head-to-head on the tools behind the charts, the Exploding Topics vs Google Trends comparison lays out where the free product stops and paid data starts.