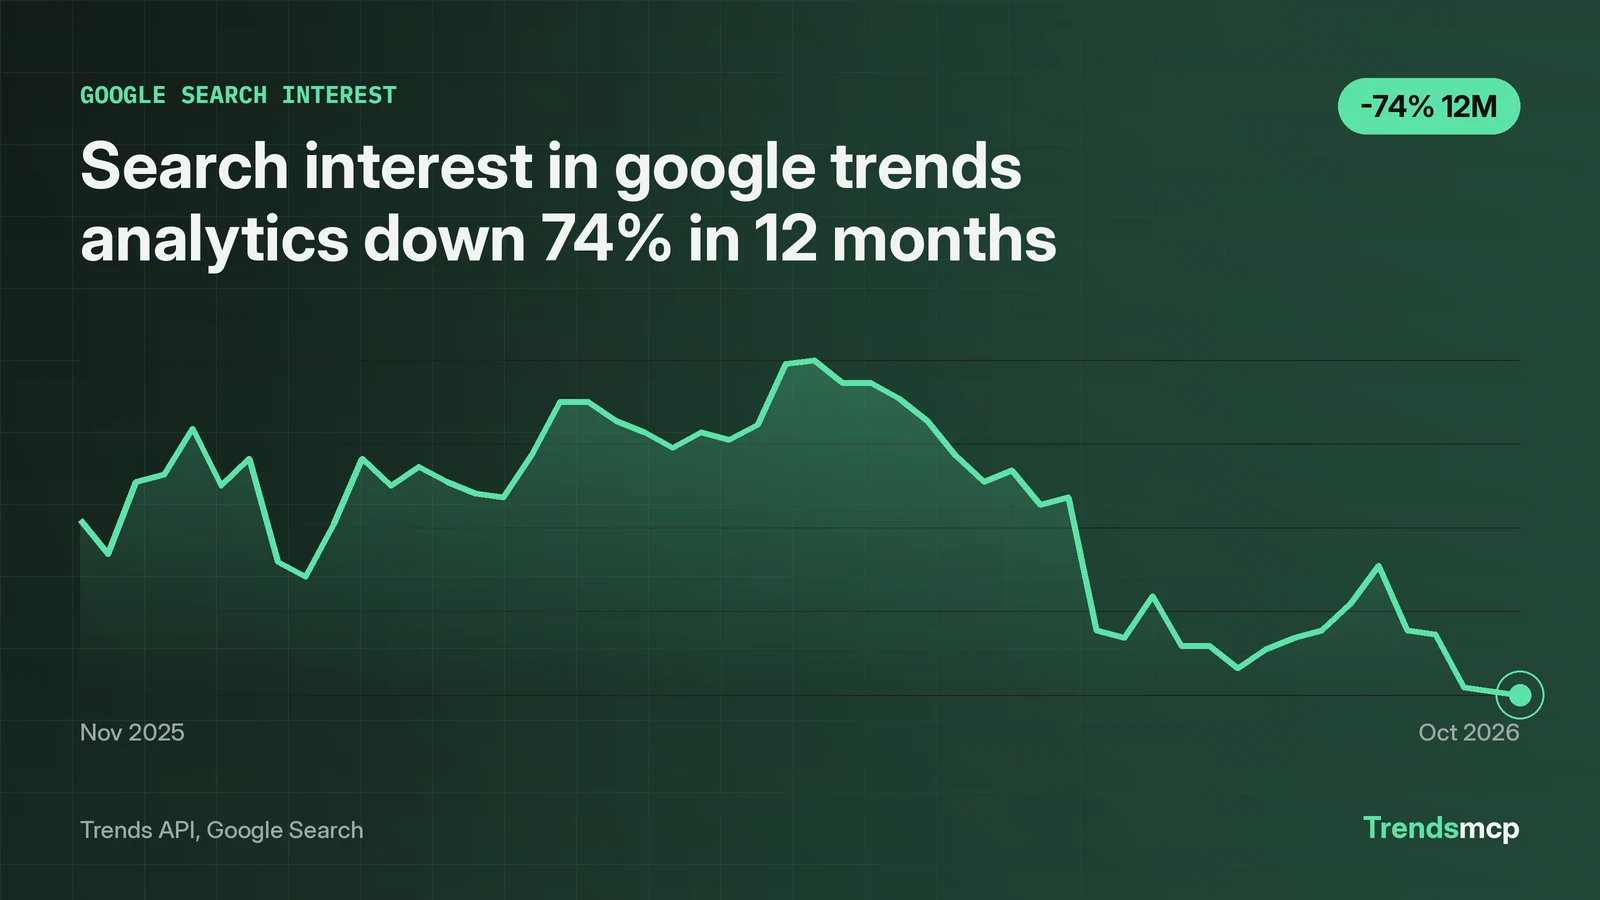
Google Trends analytics means turning Google Trends data into an answer, and the fastest route is the API, not the website chart. Search interest in the phrase "google trends analytics" itself sat at 12 on the 0-100 index in the week of October 31 2026. That is 12% of its peak of 100 in the week of May 9 2026, and a 74% fall from 47 in the week of November 1 2025. The index measures a term against its own peak, never against all searches, so 12 means 12% of that May peak. This guide runs the exact calls: pull the five-year series, read the index, compare terms with growth instead of index levels, and check what people are asking about the topic right now.
The query hides three different questions
The phrase "google trends analytics" is three questions wearing one label: how to use Google Trends, how to read its numbers, and how to pull the same data through code. Keyword Planner puts the phrase at 590 searches a month with LOW competition: a small, specific audience.
Each of the three questions has its own tool. The website chart answers the first. The series call answers the second. The series and growth calls together answer the third: they pull the numbers through code instead of a chart. The rest of this guide works through all three in order, using the phrase itself as the test case, so every number below comes from a call run on November 6 2026.
Pull the five-year series before opening any chart
The series call comes first because it returns the raw weekly points the website chart only draws. One call returns about five years of history, and every later step reads from it.
python tools/trends.py series --keyword "google trends analytics" --source "Google Search"
The same call over REST:
curl -X POST https://api.trendsmcp.ai/api \
  -H "Authorization: Bearer YOUR_API_KEY" -H "Content-Type: application/json" \
  -d '{"mode": "get_time_series", "keyword": "google trends analytics", "source": "Google Search"}'
From Claude, Cursor, or any client with the MCP server connected, the same request is one sentence: "Using Trends MCP, show me the Google Search trend for google trends analytics over the past 5 years."
The data shows 261 weekly points, from November 6 2021 to October 31 2026. The first point reads 16 and the latest reads 12. The peak sits in the week of May 9 2026 at 100, and five straight weeks in May 2026 read 90 or above: 99, 100, 94, 94, and 90, averaging 95.4. Each call costs 1 request, and the free plan allows 100 requests a month, so this whole workflow costs a handful of requests.
One limit shows up at once: the response carries no volume value on any of the 261 points. The series answers how interest moved and never how many searches sat behind the move. Absolute volume needs a different source, and the next sections show where it comes from.
Read the 0-100 index as a share of the peak
A reading of 12 means searches in the week of October 31 2026 ran at 12% of the level in the peak week of May 9 2026, and nothing more. The index explainer covers how the 0-100 scale works in full; the numbers below are what matters for this phrase.
Averages guard against reading one week as a trend. The last 12 weeks averaged 25.2, against 60.6 in the 12 weeks before that, so the low single-week reading of 12 is the tail of a slide, not a cliff edge. The series peaked in May, stayed high through that month, then fell across the summer and autumn.
To size the audience, Keyword Planner gives 590 monthly searches for the exact phrase. That number and the index answer different questions and never substitute for each other: one estimates how many people search, the other shows how that attention moved over time.
Compare terms with growth, never with index levels
Index levels cannot be compared across terms because each series peaks at its own 100, so growth over the same window is the fair comparison. The growth call compares two dates inside one series, and those percentages can sit side by side.
| Term | 12-month change | Recent reading | Baseline reading |
|---|---|---|---|
| google trends analytics | -74.47% | 12.0 (Oct 31 2026) | 47.0 (Nov 1 2025) |
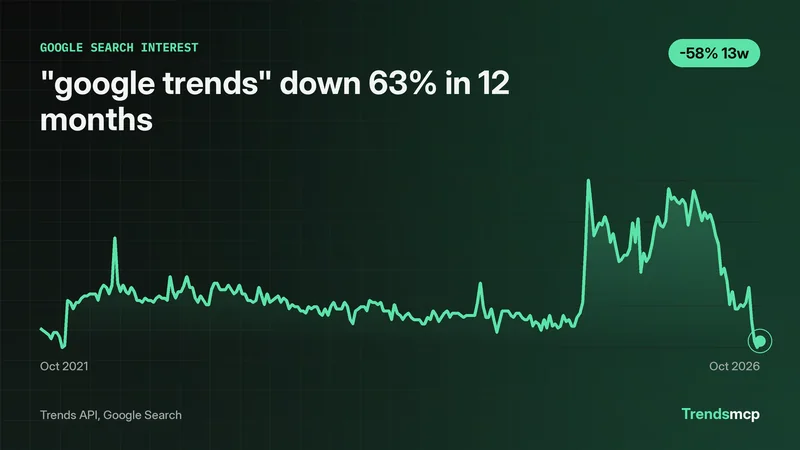
| google trends | -63.24% | 25.0 (Oct 24 2026) | 68.0 (Oct 25 2025) |
| google analytics | -40.98% | 36.0 (Oct 31 2026) | 61.0 (Nov 1 2025) |
The three-month figures tell the same story on a shorter window: "google trends analytics" fell 68.42%, from 38.0 on August 1 2026 to 12.0 on October 31 2026, while "google trends" fell 57.63%, from 59.0 on July 25 2026 to 25.0 on October 24 2026.
One honest wrinkle: the "google trends" series ends a week earlier, October 24 instead of October 31, so treat the comparison as approximate rather than exact.
The data shows all three terms fell over 12 months, with the analytics phrase falling furthest. This suggests interest in the topic cooled after the May high, but the API carries no reason for the move, so the cause stays an open question.
Turn the numbers into an answer
A defensible answer to "google trends analytics" reads: interest in the phrase peaked in May 2026 and has fallen 74% since last November, with the last 12 weeks averaging 25.2 against 60.6 in the 12 weeks before. That sentence is the whole workflow, compressed.
The five steps, in order:
- Pull the series for the exact phrase with
get_time_series, and note the first point, the latest point, and the peak week. - Read the latest point as a share of the peak, and check the 12-week average before trusting a single week.
- Run
get_growthfor 3M and 12M on the same phrase, and write down both endpoint dates. - Compare the phrase against nearby terms with growth, never with index levels.
- Check context for what sits behind the move, and say plainly when the data cannot explain it.
Step 5 is where the context call earns its place. A get_context call for "google trends" on News returned 10 stories from the last 7 days. The most covered story, carried by 3 outlets, was midterm election searches ranking among the top Google searches. That tells a reader what the topic looks like right now, in the week the numbers were pulled.
The May 2026 spike is the piece the workflow cannot close. The context tool looks back at most 30 days, so it cannot reach a spike from six months ago, and the series itself records the move without a reason. Any explanation of that spike needs a separate check against May 2026 news, and this guide leaves it unverified rather than guessing.
Three more limits shape how far the answer reaches. Growth compares single weeks, so a holiday week or a news spike at either endpoint can bend the percentage. Weekly resolution hides moves inside a week; daily resolution exists for the last 90 days on Google sources when the question needs it. And the Google Search series carries no volume, so the size of the audience always comes from Keyword Planner, not from the index.
Run the same five steps on any other phrase; the calls stay the same, only the keyword changes. The Python version of the series call is in Google Trends API Python, the no-code route through an assistant is in MCP server for Claude, the full tool reference sits in MCP docs, and a comparison of API options is in best Google Trends APIs.