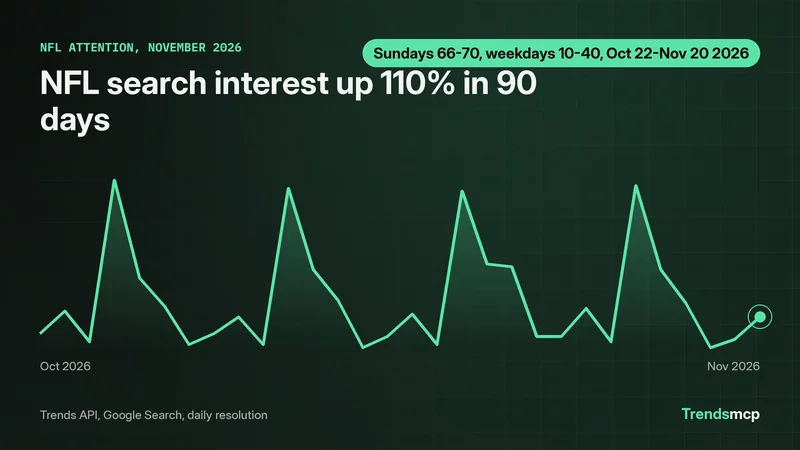
Comparing a trend across platforms means running the same question on each one and reading the disagreements. For "gta 6" on November 21, Google Search growth over 7 days was 145%, YouTube was 200%, TikTok returned no data, and Reddit growth is disabled. For "anthropic stock", Google Search rose 150% in 7 days while YouTube rose 44%. For "nfl", Google Search rose 14% in 7 days while TikTok volume fell 27%. No platform agrees with the others, and that is the point: each one measures a different behavior. The method is one growth call per platform, the same window lengths on each, and a table that keeps the gaps visible instead of averaging them away.
Start with one keyword and the same windows
A cross-platform comparison fails before it starts when the keyword changes between calls. "gta 6" on Google Search and "GTA VI" on YouTube are two different queries with two different histories. Pick one spelling and use it everywhere. The same goes for windows. A 7-day change on one platform and a 30-day change on another cannot sit in the same column.
The windows used below are 7 days and 30 days for every platform, with the same keyword on each. Growth figures are point-to-point on weekly index values. The Google Search and YouTube growth windows end November 14, 2026, while the TikTok volume windows end November 18, 2026. Matching windows is what makes the numbers comparable. If one platform's series ends on a different date than the others, say so in the table instead of hiding it.
Run the growth call on each platform
One call per platform, same keyword, same windows:
python tools/trends.py growth --keyword "gta 6" --source "Google Search" --windows 7D 30D
python tools/trends.py growth --keyword "gta 6" --source "YouTube" --windows 7D 30D
python tools/trends.py growth --keyword "gta 6" --source "TikTok" --windows 7D 30D
python tools/trends.py growth --keyword "gta 6" --source "Reddit" --windows 7D 30D
Three keywords run through those calls on November 21 give this table. Every cell is a 7-day figure unless marked otherwise. Google Search and YouTube growth windows end November 14, and TikTok volume windows end November 18.
| Keyword | Google Search | YouTube | TikTok | |
|---|---|---|---|---|
| gta 6 | +145% (33 to 81) | +200% (10 to 30) | no data | growth disabled |
| anthropic stock | +150% (2 to 5) | +44% (9 to 13) | no data | growth disabled |
| nfl | +14% (37 to 42) | +4% (52 to 54) | volume -27% | growth disabled |
The 30-day column sharpens the picture. "gta 6" rose 376% on Google Search and 131% on YouTube over 30 days. "anthropic stock" rose 400% on Google Search over 30 days, from 1 to 5. "nfl" rose 2% on Google Search over 30 days but fell 22% on YouTube, from 69 to 54. TikTok volume for "nfl" fell 39% over 30 days, from 270,015,131 to 165,753,284.
Read the table row by row, not column by column. A row is one keyword's story: "gta 6" is rising everywhere it can be measured, "anthropic stock" is a small-base search spike with a smaller video echo, and "nfl" is flat on search, cooling on video and shrinking on TikTok. A column is one platform's temperament, and comparing columns directly is how readers get misled.
Read the series, not just the percent
A growth percent hides the shape of the move. Pull the daily series for the two platforms with data and put the curves next to each other:
python tools/trends.py series --keyword "gta 6" --source "Google Search" --resolution daily
python tools/trends.py series --keyword "gta 6" --source "YouTube" --resolution daily
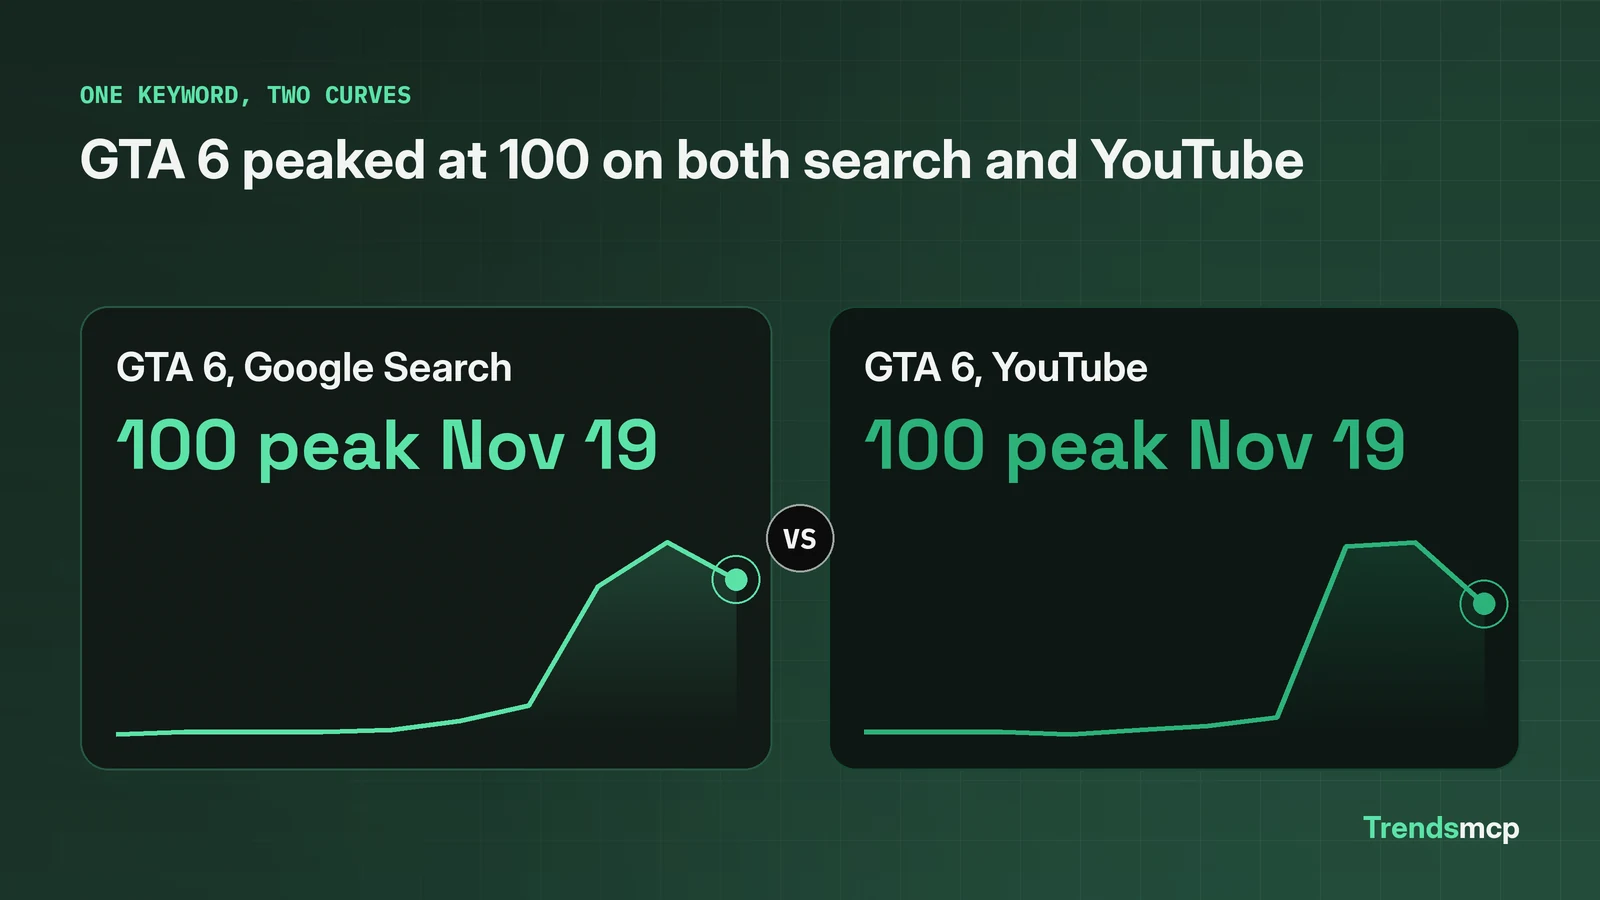
Both "gta 6" series run 92 daily points from August 21 to November 20, 2026, and both peaked at 100 on November 19. Two days later, "gta 6 reviews" still topped the Google Trends board. The curves differ in how they arrived. YouTube moved a day ahead of search: it read 98 on November 18 while search read 80, and both hit 100 on November 19. YouTube also fell faster, to 70 on November 20 against search at 83. Before November 17, both sat low: search at 26 and YouTube at 15 on November 17, after six days under 20 for search and under 12 for YouTube.
That shape is the useful finding. A single percent would say YouTube grew faster than search over 7 days, 200% against 145%, and stop there. The series says video attention arrived first, peaked with search, and faded faster. Anyone planning content around the spike would post video first and search content second, and would expect the video window to close sooner.
Treat missing data as an answer
Half the table above is gaps, and the gaps carry information. TikTok returned no time series data for "gta 6" or "anthropic stock", so there is no TikTok growth figure for either keyword. TikTok does have "nfl" data, but only from October 20 to November 18, so its 90-day window returns an error: growth_calculation_failed, no growth window could be calculated. Reddit growth is disabled in the API and returns a source-disabled error, and Reddit context returned "source unavailable" for both "nfl" and "gta 6" on November 21. X is not a growth source at all, so it never appears in a growth table.
Write the gap into the table in plain words: "no data", "growth disabled", "source unavailable". A blank cell reads as a zero. A labelled gap reads as a limit, and it tells the reader something real: TikTok and Reddit coverage is thinner and less reliable than Google Search and YouTube coverage for these keywords today.
One more trap sits inside the numbers that do return. The YouTube 30-day growth for "anthropic stock" comes back as 999999.0. That is not a percent. The baseline index is 0, so the API returns a placeholder where division by zero would sit. The honest statement is that the index moved from 0 to 13. Any percent built on a zero baseline is meaningless, and the placeholder is easy to paste into a chart by mistake.
The exact calls to copy
The whole comparison is four growth calls, two series calls, and one table. The growth calls accept several sources in one call, which returns a summary across them:
python tools/trends.py growth --keyword "gta 6" --source "Google Search, YouTube" --windows 7D
That call returned 2 sources processed, 2 successful, 2 in uptrend, an uptrend ratio of 2/2 and 100%. The single-source calls give the per-platform numbers for the table; the multi-source call gives the quick verdict.
In Claude with the Trends MCP server connected, one prompt runs the same comparison: "Compare growth for 'gta 6' on Google Search, YouTube and TikTok over 7 and 30 days, and flag any source that returns no data." The MCP server for Claude page covers setup, and the Claude trend research workflow shows the loop around it. The same call works over the REST API:
curl -X POST https://api.trendsmcp.ai/api \
  -H "Authorization: Bearer YOUR_KEY" \
  -d '{"mode": "get_growth", "source": "google search", "keyword": "gta 6", "percent_growth": ["7D", "30D"]}'
The data catalog lists which sources support growth, series and context, so check it before assuming a platform is covered. The best cross-platform trend analysis tools page compares the tools that do this job, and how to verify a trend covers the checks that come after the comparison. The GTA 6 release attention piece is the deeper dive on the example keyword used here.
Three mistakes that break a comparison
First, mixing windows. A 7-day figure and a 30-day figure in the same column is not a comparison. Keep the windows identical and the end dates identical, or label the difference in the cell.
Second, mixing index with volume. The Trends API returns a 0 to 100 index and, where the source has it, an estimated volume. The "nfl" TikTok figures above are volume changes, down 27% in 7 days: TikTok returns estimated volume, not a 0 to 100 index, for this keyword, with 165,753,284 in estimated volume at the end of the window. An index percent and a volume percent are different units. Never put one in a column headed by the other.
Third, trusting a percent off a tiny or zero base. "anthropic stock" rose 400% on Google Search in 30 days, from an index of 1 to 5. The percent is correct and the move is small. Always print the two index values beside the percent so the reader can see the base. A 400% rise from 1 to 5 is a blip; a 14% rise from 37 to 42 on "nfl" is a large audience moving a little. The base is the context, and without it the percent misleads.