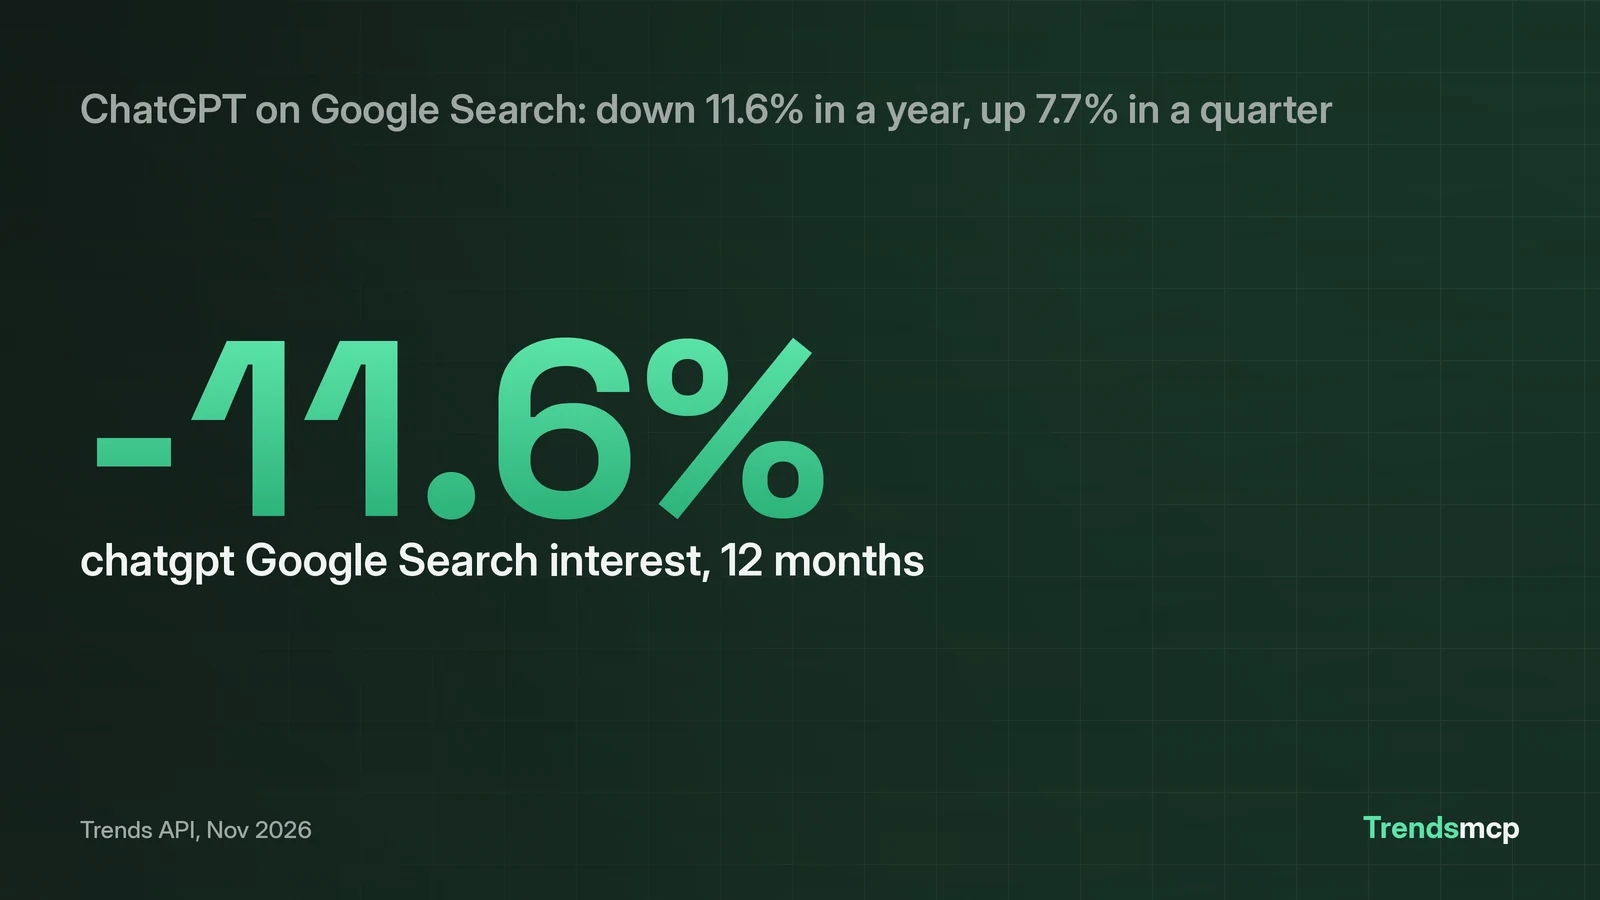
Analyzing Google Trends data with an AI assistant means connecting the assistant to live trend data, then asking it to do the analysis in plain language. The assistant pulls growth windows and full series through tool calls, reads the baselines and recent values, and reports what moved with the caveats attached. The worked example below uses a real pull from November 4, 2026: Google Search interest in "chatgpt" fell 11.6% year over year while rising 7.7% over the last quarter. Every number traces to one tool call, and the prompt that produced it is printed in full.
Give the assistant the data first
An AI assistant cannot analyze Google Trends data from memory, and its training data holds no numbers for this week. The fix is a live connection. The Trends MCP server plugs into Claude, ChatGPT, Cursor, and other assistants through the Model Context Protocol, and the same key works for the REST API when the reader prefers code; both are documented in the Trends MCP API reference. The MCP setup guide covers installation, and the Claude connection walkthrough shows the exact config block.
Once connected, the assistant has five tools: get_time_series for full history, get_growth for rise rates over chosen windows, get_top_trends for live ranked boards, get_context for what people are posting about a keyword, and get_usage for quota. For a trends analysis, get_growth is the starting call and get_time_series is the second.
The prompt that produces a real analysis
Vague prompts get vague answers. This one names the keyword, the source, the windows, and the shape of the answer:
Analyze Google Trends demand for "chatgpt" on Google Search.
Pull get_growth for windows 3M and 12M, then get_time_series for the same
keyword and source. Report: the growth figures with baseline and recent
values and dates, the direction of each window, what the series shows over
the last 12 months, and one sentence on what the numbers cannot tell us.
Report the growth figures as returned, to one decimal place.
A good prompt does four things: it names the exact tool, it fixes the windows, it demands the raw inputs behind each figure, and it asks for the limit. The last two are what separate an analysis from a paraphrase of a chart. If the assistant ever answers from memory instead of calling the tool, the missing piece is usually the explicit tool name in the prompt.
What the assistant calls behind the scenes
The assistant's first move is a single get_growth call that covers both windows at once:
{
  "tool": "get_growth",
  "keyword": "chatgpt",
  "source": "Google Search",
  "percent_growth": ["3M", "12M"]
}
The REST equivalent, for readers wiring this into a script:
curl -X POST https://api.trendsmcp.ai/api \
  -H "Authorization: Bearer YOUR_KEY" \
  -H "Content-Type: application/json" \
  -d '{"mode": "get_growth", "keyword": "chatgpt", "source": "Google Search", "percent_growth": ["3M", "12M"]}'
Then, for the full series behind the growth rows:
{
  "tool": "get_time_series",
  "keyword": "chatgpt",
  "source": "Google Search"
}
One call costs one request, and every window in the percent_growth list is included in that single request; the API tool reference documents the per-call cost of each tool. The response returns the baseline value and date, the recent value and date, the percentage, and the direction for each window.
Pick windows that match the question
The windows are the analysis. A 12M window answers whether demand is structurally rising or cooling; a 3M window answers whether the last quarter changed the story; YTD answers how the year is shaping up (an available window not pulled in this example). Ask for all three when the reader needs the full picture, and ask for one when the question is narrow. The worked example below shows why two windows beat one: the 12M and 3M figures point in opposite directions, and that tension is the finding.
Country matters too. Google time series and growth default to worldwide; passing a country code narrows to one market (per the Trends API data catalog). A product launch analysis usually wants the launch market, while a cultural trend piece usually wants worldwide. Name the market in the prompt so the assistant does not silently default.
Reading the growth numbers without fooling yourself
Google Search interest in "chatgpt" dropped 11.6% year over year: index 95 on October 25, 2025, then 84 on October 24, 2026. Those figures come straight from the November 4, 2026 pull. Over the last three months it rose 7.7%: index 78 on July 25, 2026, then 84 on October 24, 2026. The honest read: long-term interest cooled from its peak, while the recent quarter stabilized and ticked upward.
Three rules keep this analysis honest. First, growth is point-to-point: one recent week against one baseline week, so a single noisy week can move the figure. When a figure looks surprising, ask the assistant to pull the series and check whether the baseline week was an outlier. Second, the index is relative, scaled 0 to 100 per keyword and source; it shows share of attention, not search counts. Third, a spike is not proof of a cause: say what moved and on which dates, then attribute carefully.
Save the analysis so it ages well
Trend numbers expire fast. An analysis that reads "interest fell 12%" without a date is wrong within weeks, because the next pull will show different figures. Record three things with every analysis: the date the data was pulled, the exact tool call including windows and country, and the baseline and recent dates behind each figure. With those three, a future reader can re-run the same call and see what changed. The worked example here records all three: pulled November 4, 2026, get_growth with 3M and 12M windows on Google Search worldwide, baselines October 25, 2025 and July 25, 2026.
Cross-check against a second source
One source is a claim; two sources are an analysis. The same get_growth call accepts multiple sources, so the follow-up prompt is short:
Run the same get_growth analysis for "chatgpt" on YouTube, windows 3M and 12M.
Compare the direction and size of each window against the Google Search results,
and say in one paragraph what the difference implies about where demand is moving.
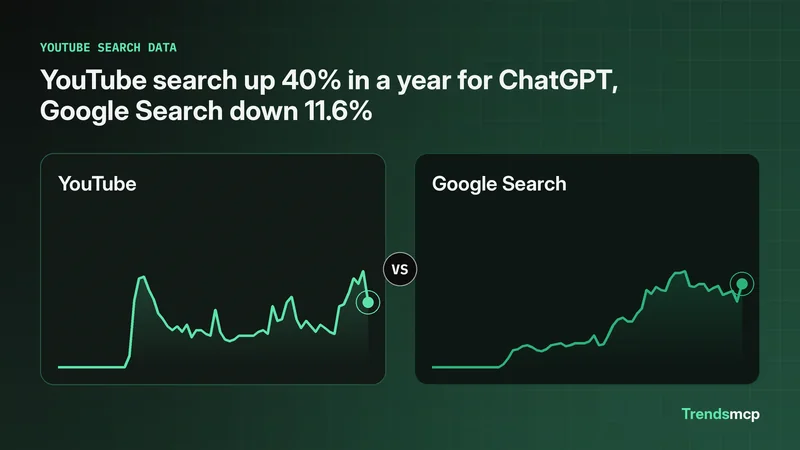
The November 4 pull returned a genuine split: ChatGPT's YouTube search interest rose 20.7% over three months and 40% over twelve, against Google Search's 7.7% and -11.6%. The implication, labelled as inference rather than data: web search interest in "what is ChatGPT" cooled while YouTube search demand for tutorials and walkthroughs kept climbing. Ask the assistant to state that as a hypothesis, not a fact, and the analysis stays trustworthy.
The Google Trends data page documents the source in full, and the Python API tutorial covers the same calls for readers who want them in a script instead of a chat.